
“Tell someone that everything will be ok and they’ll shrug you off. Tell someone they’re in danger and they’ll hang on your every word.” Morgan Housel, author of Psychology of Money
NATO could be drawn into the Russia – Ukraine conflict.
Oil prices could skyrocket.
Inflation could remain stubbornly high.
Higher interest rates could trigger a recession.
The Fed could screw everything up.
Crafting a narrative for what could go wrong is easy. It’s more exciting too.
In our July 22, 2021 post, “Intoxicated with Pessimism,” we highlighted how pessimism comes off as sophisticated, while optimism come off as oblivious.
We aren’t pessimistic or optimistic. In our opinion, an investor would do well to ask a question not many are asking…
What’s the bullish case for stocks?
We are reminded of one of Bob Farrell’s investment rules.
“When everyone agrees, something else happens.”
Poor Returns Can Lead to Better Returns
We often tell our clients the best time to get more aggressive is when it feels the worst.
It’s not just a cheeky statement, it’s backed by evidence.
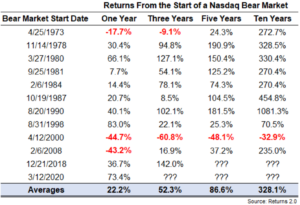
Source: Ben Carlson, A Wealth of Common Sense blog
The above graph shows NASDAQ returns after the start of a bear market (-20% return, which the NASDAQ breached on 3/20/22). Aside from 2000, the tech-heavy index was positive in every instance over the next five and 10-year period.
Here’s a summary of S&P performance after dismal starts to the year…
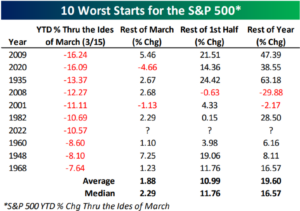
Source: Bespoke Investment Group
The above graph shows S&P 500 performance after poor starts to the year. There are exceptions, but returns for the remainder of the year tend to be strong.
Investor Sentiment is in the Dumps
It’s fascinating that investors feel worse now than they did during the apex of the COVID sell-off in 2020 (we covered the phenomenon in “Checking Up on Pandemic Darlings.”).
It’s counterintuitive, but when humans feel bad about stocks, future returns tend to be overwhelmingly positive.
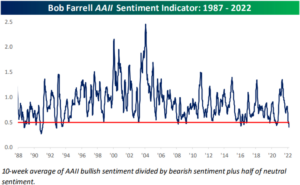
Source: Bespoke Investment Group
The above graph shows Bob Farrell’s sentiment indicator (1987 – 2022). The lower the line, the worse investors feel about stocks. According to Farrell, when the dark blue line drops below the 0.5 (red line), the market was ready to rally.
Bob Farrell might have been on to something…
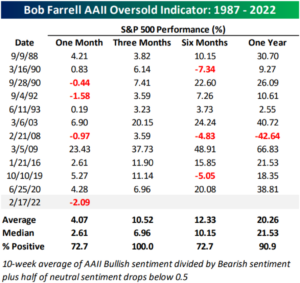
Source: Bespoke Investment Group
The above data shows returns for the S&P 500 (1987 – 2022) after Bob Farrell’s Sentiment Indicator drops below 0.5. One year later, the S&P was higher ~91% of the time with an average return of 20.26%.
Valuations
Stocks are still historically expensive based on trailing price to earnings (P/E). However, an argument could be made that the froth has come off.
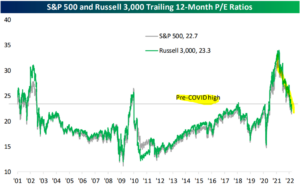
Source: Bespoke Investment Group
The above shows the trailing 12-month P/E for the S&P 500 (gray) and Russell 3,000 index (green). Stocks are cheaper today vs. the pre-COVID high in late 2019. We should note valuation is an important input, but a terrible timing tool. Expensive markets can stay expensive and vice versa.
Volatility Index (VIX)
The VIX is a measure of expected market volatility over the short term. Higher VIX readings often translate to wild swings in stock prices.
It’s not a surprise that the VIX index has been elevated over the past 11 days.
Recently, the VIX recently dropped below 30 (after spending 11 days above 30). Historically, drops in expected stock price volatility have been a positive catalyst for stock prices.
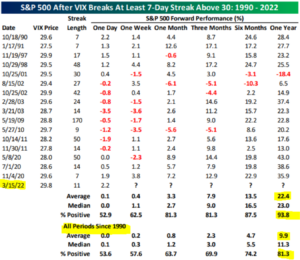
Source: Bespoke Investment Group
The above data shows S&P 500 returns after the VIX breaks a seven-day streak over 30 (1990-2022). Again, returns one year later are positive 93.8% of the time with an average return of 22.4%.
We aren’t predicting stocks race higher from here. The above information is a thought exercise on what could go right (said another way, how the herd could be wrong).
The world could still go to hell in a handbasket. However, a savvy investor shouldn’t anchor to one identity or outcome.
The last two years have further highlighted the absurdity of market forecasts.
In December of 2019, who had a global pandemic on their radar? Nobody.
In December of 2021, who had Russia invading Ukraine? Nobody.
When the consensus forecast is overwhelmingly one-sided, our radar goes up.
When everyone agrees, something else happens.