“I don’t get why anyone would buy a 10-year bond yielding 1.5%” – Former Colleague
Low bond yields are the new normal. It’s enough to make seasoned money managers’ and investors’ heads explode.
“Back in the late 1970’s we used to get 10% on a CD!”
I would counter, “you also had a 13% rate on your mortgage, and inflation was running 12% annually. Do you really think that’s better?”
From the novice to the professional investor, there seems to be a reluctance to embrace bonds given the perma-low interest rate environment.
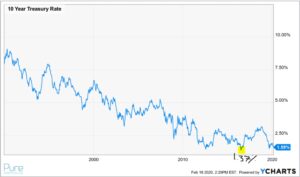
We went back and found the cycle-low yield (thus far) for the 10-year U.S. Treasury.
Source: Ycharts
The above chart shows the 10-year US Treasury yield. On July 8th, 2016 the 10-year yield hit a cycle-low of 1.37%.
Are low yields a good reason to shun bonds?
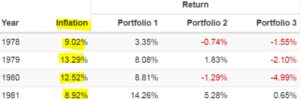
Before we answer that question, it’s important to make a distinction between nominal yield (before inflation) and real yield (after inflation). We return to the late 70’s and early 80’s to see how such a seemingly small distinction can have a huge impact on investor purchasing power.
Source: Portfoliovisualizer.com
The above graphic shows calendar year returns for short-term US Treasuries (portfolio 1), 10-year US Treasuries (portfolio 2), and long-term US Treasuries (portfolio 3) from 1978 to 1981. At first glance, the nominal (before inflation) returns look fine.
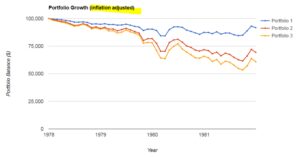
However, when we factor inflation into the equation, we get a much different picture.
Source: Portfoliovisualizer.com
The above graph shows the same set of return data as the above table, but factors in the inflation to show our real return. Notice how short-term Treasuries (portfolio 1) posted solid nominal returns, but after factoring in inflation, lost purchasing power from 1978 to 1981. Long-term bonds did much worse, losing almost 50% of their purchasing power due to multiple years of elevated inflation.
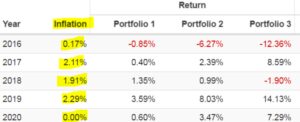
That brings us to today, we start at the cycle-low for the US 10-year Treasury, and run performance for short-term, intermediate, and long-term US Treasuries. Can we generate a positive real return for bond investors despite coming off rock bottom yields?
Source: Portfoliovisualizer.com
The above graphic shows calendar year returns for short-term US Treasuries (portfolio 1), 10-year US Treasuries (portfolio 2), and long-term US Treasuries (portfolio 3) from July 2016 to January 2020. Once again, the returns in the right columns are before inflation. Note: 2020 inflation is 0% because we have incomplete data.
When we factor in inflation (below), we get a much better real return picture vs. the late 70’s/early 80’s, despite coming off the cycle-low in yields.
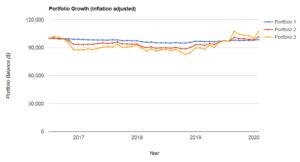
Source: Portfoliovisualizer.com
The above graph shows the same set of return data as the above table, but factors in the inflation to show our real return. Despite coming off the cycle low in the 10-year Treasury yield, bond returns across the yield curve posted positive real returns.
While it is dangerous to draw absolute conclusions from such a small sample size, we can make a few observations…
- Bond investors can still generate positive returns from fixed income, coming off generationally low yields.
- Long bonds can be more volatile than short and intermediate term bonds, especially during periods of elevated or unexpected inflation.
- High nominal (before inflation) yields do not mean a high real return. Inflation and real returns matter. Look no further than the late 70s and early 80s.
No one is clamoring to buy a US Treasury bonds with illusions of getting rich. High quality bonds are meant to be boring.
Within the context of a balanced portfolio, bonds are there to offset riskier equity positions. Refrain from looking at bonds or any asset class in a silo. A properly built portfolio will feature multiple assets that work together to produce an acceptable risk/return profile for your investment program.
