“If you believe markets are mean-reverting, higher returns and lower volatility today may equal the opposite in the future. We will enjoy the quiet while it lasts, but in our view the current environment is not sustainable.”– Pure Portfolios, What’s All This Volatility Talk? (December 13, 2017)
The above quote is not some “I told you so” moment regarding the recent market turbulence. Rather, our note was a precursor to normalcy. I’ll repeat, what’s going on now is normal. 2017, the year of fast gains and no disruptions, was the statistical outlier unlikely to be repeated.
In our opinion, extended periods of market calm do the average investor a huge disservice. Humans are pattern seeking beings that often extrapolate recent events into the future i.e. positive outcomes result in more positive outcomes.
As the winds started to shift in early 2018, we sent the below note to our clients:
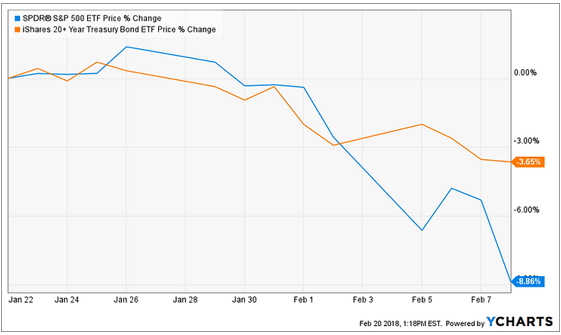
“Traditional safe-haven assets i.e. bonds & gold sold off right along with equities. There was no place to hide. On Monday, those safe-haven assets were reacting as they should; providing stability to offset the sharp move lower in equities.”
In other words, if traditionally safe assets (bonds, gold) start behaving like stocks we are in trouble. The good news for diversified investors is the two seldom act the same.

Source: Pension Partners, YCharts
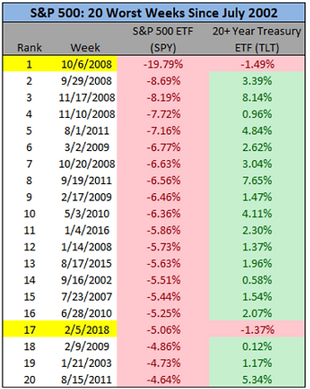
The above chart shows the S&P 500’s 20 worst weeks since 2002. The second, mostly green column, shows performance of 20+ year maturity U.S. Treasury bonds. You can see bonds are rarely negative when stock prices are down. The week of 2/5/2018 (highlighted in yellow) was an exception, not the rule.
Going back even further, we find the relationship holds true through 90 years of market data (the chart was too messy to share on the blog):

Source: Charlie Bilello, Pension Partners
Where does that leave us today?

Since early February, stocks (blue) & bonds (orange) have resumed a more normal relationship (see correlation table below). Year to date correlations look healthy (we follow this very closely). A portfolio’s conservative investments should act differently (have negative correlations) than the more risky holdings.

Tip: Do-it-yourself investors can use free tools like portfoliovisualizer.com to understand how their holdings move in relation to one another. Go to the portfoliovisualizer.com, click ‘Asset Correlations’, enter your ticker symbols, choose the date range, click ‘View Correlations”. If correlations are positive numbers, you could be taking more risk than intended.
If the recent disruption made you freak out or squirm, you could be invested incorrectly. We are back to normal.
