“A cycle like this does not end with a mere month-long correction. A real bear market is only over when no one is interested in stocks anymore. You must feel sick when you think of equities.” – Felix Zulauf, President of Zulauf Asset Management.
This time really is different. The global economy has never shut down to counter a deadly virus.
A few weeks back, we noted a market bottom could potentially be signaled by three things:
- Federal Reserve throwing the kitchen sink to lower interest rates and keep liquidity flowing. Check.
- Fiscal Stimulus package to provide temporary relief to households, small business, aid to states, corporate lifelines, etc. Check.
- Peak Cases & Containment of the virus. Incomplete, but signs of progress…
Source: Bespoke Investment Group
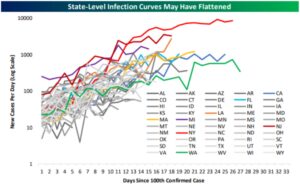
The above graph shows the infection curve for all 50 states. With a few exceptions, most every line is flatlining or heading down. We should note testing is still not widely available; take the data with a grain of salt.
Is the worst behind us or is this a classic bear market rally?
Source: Bespoke Investment Group
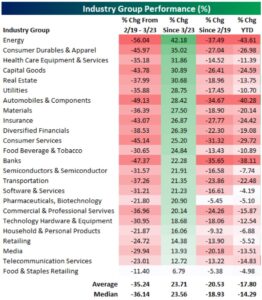
The above graphic shows industry group returns for four different periods. The deepest losses are dark red while the largest bounces are in dark green. Energy, Banks, Consumer Services, and Autos were among the hardest hit.
Source: Bespoke Investment Group
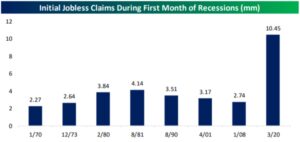
The above graph shows initial jobless claims during the first month of a recession. We’ve never even sniffed 5 million unemployed during the onset of a recession. Unbelievably, over 10 million people lost their jobs as of the 3/20 report.
This will touch every corner of the U.S. economy. Humans need jobs to pay rent, mortgages, auto loans, credit cards, etc.. 70% of our economy revolves around Americans buying stuff. The impact on consumer spending and corporate earnings is likely to be intense.
How bad is the economic damage?
Source: Bespoke Investment Group
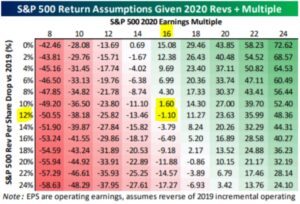
We don’t expect anyone to make sense of the above graph (Twitter would call this chart crime). It basically conveys for the market to stabilize at current levels either a) corporate revenue doesn’t fall much (unlikely in our opinion) b) multiples need to expand.
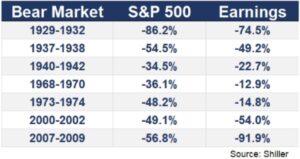
Source: Ben Carlson, CFA. A Wealth of Common Sense Blog.
The above chart shows S&P returns during Bear Markets. The percentage change in corporate earnings is in the right column. It’s simplistic, but stock returns are a function of future cash flows (corporate profits). If earnings are worse than expected, it’s tough to imagine stock prices stabilizing at current levels.
The hard impact will become more clear next week. JP Morgan kicks off Q1 reporting on April 14th which will start what is likely to be an ugly earnings season. Companies should get a pass on horrible numbers and will likely take full advantage to pile on a heap of bad news. We expect upcoming corporate earnings to be awful.
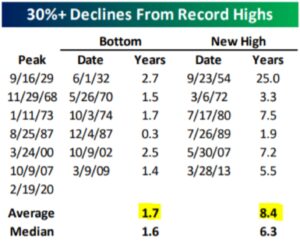
Looking at previous bear markets, it’s extremely rare to get a 30+% decline from record highs and then snap back immediately.
Source: Bespoke Investment Group
The above graphic shows the market bottom is found on average 1.7 years after a 30% decline from record highs. If we have found a bottom, it would have been the quickest bear market bottom in history (one month). Only the sharp correction of 1987 (Black Monday) comes close at three months. New market highs are found 8.4 years later, although the small data set is skewed by the Great Depression. The median of 6.3 years to new high is a better measure.
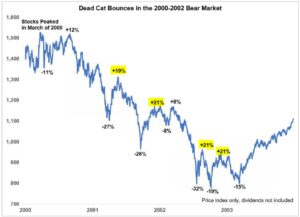
Perhaps more confusing, we are likely to see several false starts or fake bottoms.
Source: Ben Carlson, CFA. A Wealth of Common Sense Blog.
The above graph shows four separate “dead cat” bounces during the 2000-2002 bear market. Volatility tends to cluster during ugly markets. A good sign of stabilization would be less intense up days, rather than huge rips higher.
So… is this rally a pump fake or is the worst behind us? Optimists have argued markets are looking well past a few bad quarters and it’ll be back to business as usual. Corporate earnings and general economic activity should bounce back with a vengeance. The counterargument is the longer the global economy is idle, the larger the tidal wave of unemployment, bankruptcies, and impairment. The depth of damage is impossible to comprehend.
We do know that a bell doesn’t ring “all clear” when the market bottoms out. Nor does economic activity resume and then the market immediately ascends higher. Jeremy Grantham captures this phenomenon best…
“Finally, be aware that the market does not turn when it sees light at the end of the tunnel. It turns when all looks black, but just a subtle shade less black than the day before.” – Jeremy Grantham, Chief Investment Officer, GMO.
It would be a pleasant surprise to have the market bottom behind us, but we aren’t betting on it. If you were squeamish during the month of March, now is a reasonable time to tighten your risk exposures.
