
“A traditional static indexing approach leaves an investor overweight the riskiest assets at the riskiest times and underweight those low risk assets when their returns are likely to be highest.”– Cullen Roche, Orcam Financial Group
The 60/40 portfolio has been a popular asset allocation for retirees. For investors looking to manage risk while still being exposed to equities, it’s tough to argue with recent history:
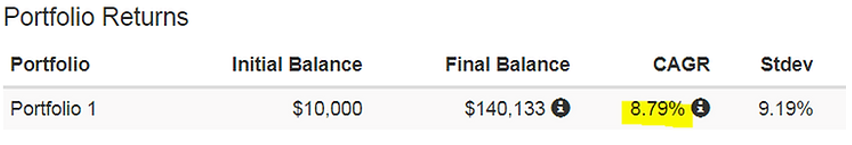
The above graph shows a 60/40 portfolio (rebalanced annually) from January 1987 to April 2018. The annualized return of 8.79% per year has made a 60/40 asset mix an attractive option.
However, there is a problem anchoring as a “60/40 investor,” as we ignore changing market dynamics and underlying risk. Stated as a question, what if I asked you which is more risky, a 60/40 portfolio in 2010 or a 60/40 portfolio in 2018?
We will make the case that a 60/40 portfolio in 2018 is more risky than a 60/40 portfolio in 2010. In fact, the underlying risk of a 60/40 today might exhibit risk characteristics that could behave more like a 80/20 or 90/10 during a market disruption.
What did the landscape look like in 2010?
S&P P/E Ratio: ~16 Inflation: 1.52% Fed Funds Rate: 0%
10 Year U.S. Treasury (1/2010): 3.85%
The U.S. economy was beginning to show signs of life after the worst financial crisis in decades. However, many investors were scarred by dramatic stock market losses. The prospect to allocating or adding to risky assets (stocks) was frightening. Running counter to our natural human instinct, this was the appropriate time to get more aggressive.
On 1/2010, GMO published the below 7-year expected returns for several equity asset classes:
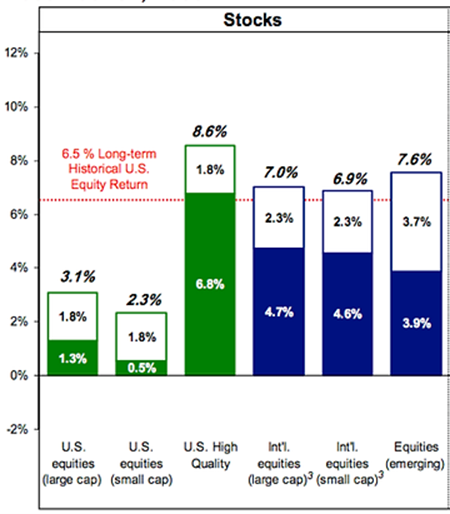
Source: GMO
Due to lower starting valuations post financial crisis, GMO’s model predicted higher future returns (above the 6.5% historical U.S. equity returns) for four equity asset classes.
What does the landscape look like today?
S&P P/E Ratio: ~25 Inflation: 2.46% Fed Funds Rate: 1.50%
10 Year U.S. Treasury (1/2018): 2.46%
The economy is growing, but not at breakneck speed. The cost of capital has been rising which is a cause for concern for an overleveraged global economy. We are in the 9th year of an appreciating U.S. stock market cycle. Many investors are embracing risky assets (stocks) and believe the positive market returns will continue.
Compare the same GMO 7-year expected returns today and we get a much different picture:
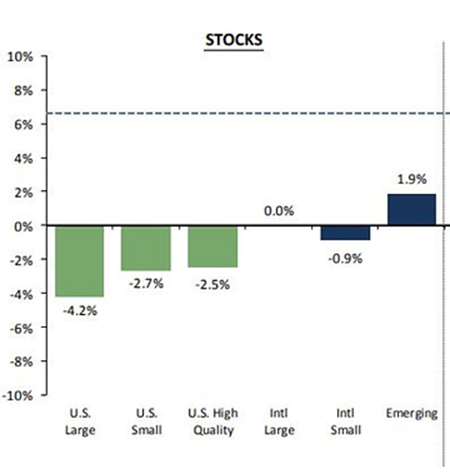
Source: GMO
U.S. equity market appreciation has currently elevated valuations, hence future returns are projected to be lower (and negative in some asset classes).
What’s the final message?
Don’t fall into identifying as a 60/40 investor. Focus on the underlying risk exposures which can evolve (sometimes dramatically) over time.
To bring the point home, let’s look at two 60/40 portfolios:
Portfolio #1: 60% S&P 500/40% US Aggregate Bond Index
Portfolio #2: 60% Micro Cap Tech stocks/40% High Yield Bonds
Focusing strictly on the 60/40 asset mix rather than the underlying risk exposures would be a huge mistake.
If you want to identify as a 60/40 investor, know that your mix of stocks and bonds will need to deviate from 60/40 as market characteristics evolve through time. For example, to get a historical risk level of a 60/40 portfolio, an investor in today’s market might be 40/60.
We aren’t advocating shifting out of equities into 100% cash. Rather, shading the asset allocation toward less risky assets during the late innings. We might leave some upside on the table, but we would rather not be extended at the end of the game.
To borrow words from the great Warren Buffett, “Be fearful when others are greedy and greedy when others are fearful.”