“If you mix your politics with your investment decisions, you’re making a big mistake.” – Warren Buffett, Berkshire Hathaway
It is not a secret 2024 is an election year. Media coverage is heating up. Official and unofficial polls are starting to emerge (538 election updated odds).
Early betting markets, polls, and probabilities show the presidential election could be quite close.
A few things piqued my interest while looking at the U.S. stock market and the ability it might have to predict the winner of the presidential election.
Before we get into the market as an “election predictor”, let’s see how politics and market returns jive…
Year Four
Source: Bespoke Investment Group
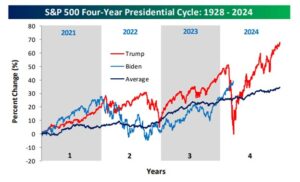
The above chart shows S&P 500 performance during the presidential cycle for Trump (red), Biden (light blue), and the average for all U.S. presidents (dark blue). Going back almost a century, year four of the presidential cycle tends to be positive for stocks.
Returns Nearly Identical Over the Long-Run
Source: Bespoke Investment Group
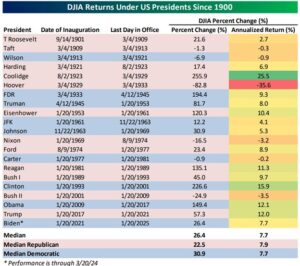
The above chart shows Dow Jones total and annualized returns under each U.S. President since 1900. The median total returns slightly favor Democrats; however, the annualized numbers are nearly identical. In my opinion, the evidence suggests there are an infinite number of factors that matter more to market returns than who is sitting in the White House.
Getting Emotional is Costly
Source: Bespoke Investment Group
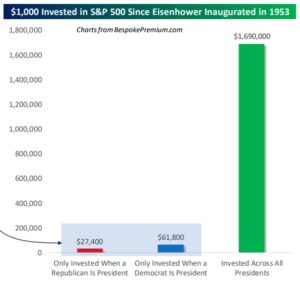
The above chart shows $1,000 invested in the S&P 500 since 1953 (through 3/20/24). The red bar shows the total amount an investor would have if they only invested when a Republican is President. The blue bar shows the total amount an investor would have if they only invested when a Democrat is President. The green bar shows an investor that stayed invested regardless of which party was in the White House. Mixing politics and investing seems to be a tried and true method of wealth destruction.
Can the stock market predict election results?
Not exactly, but it seems to have some predictive power from previous presidential election cycles…
Source: Bespoke Investment Group
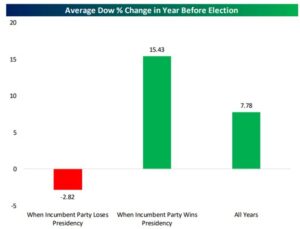
The above graph shows the average Dow Jones change in the year before a presidential election. When the market has a rough year prior to the election, the incumbent is more likely to lose. When the market has had a good year prior to the election, the incumbent is more likely to win. The Dow Jones returned ~16% in 2023.
Let’s break it down a bit further…
Source: Bespoke Investment Group
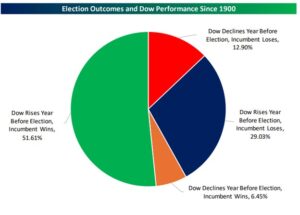
The above chart shows the percentage of time the incumbent wins or loses the next election based on the Dow Jones’ performance the previous year. We know 2023 was a good year for the Dow Jones. Previous presidential election results suggest there’s a ~51% probability the incumbent wins (green) and a ~29% probability (dark blue) the incumbent loses based on last year’s positive market return.
Between now and the election, tension, emotion, and narratives are going to heat up. In our opinion, much of the rhetoric around the election is noise.
- Markets typically do well in year four of a presidential cycle.
- Returns for Republican and Democrat presidents are nearly identical.
- Investors should not jump in and out of the market (or make large allocation decisions) based on who wins/loses an election.
- It would seem the market has some predictive power in who the next President will be.
As famous political analyst James Carville might say, “It’s the economy market, stupid.”

