Everywhere we turn people are convinced the presidential election adds a layer of uncertainty to the financial markets. Depending on your politics, the election could find you emotionally charged up.
“I can’t even look at my statement.”
“I want to get out of the market because the election has me worried.”
“I’m so nervous about the upcoming election.”
Is all of the angst justified? Is it based on historical evidence? Emotion? The media? Your personal opinion of the President?
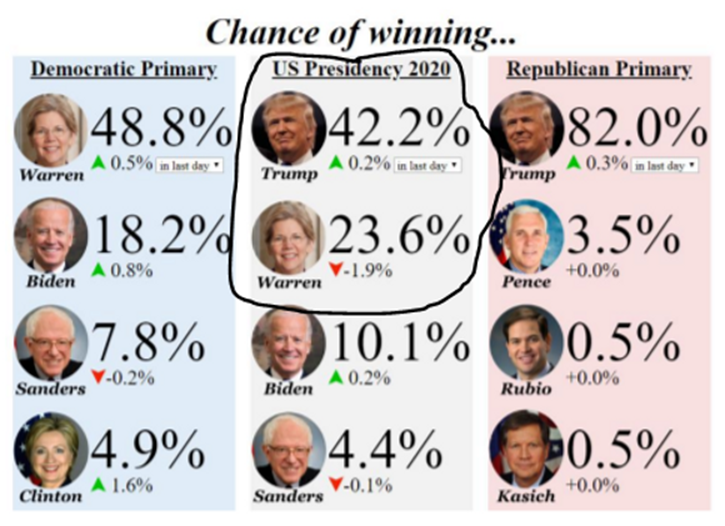
Let’s look at the most likely election outcomes based on current projections.

Source: Bespoke Investment Group, Electionbettingodds.com
Surprisingly, our data set is fairly small when evaluating election year returns. There have been 23 elections since 1928. Therefore, we are interested in evaluating the following two potential outcomes: the incumbent getting reelected, or the incumbent losing the election.
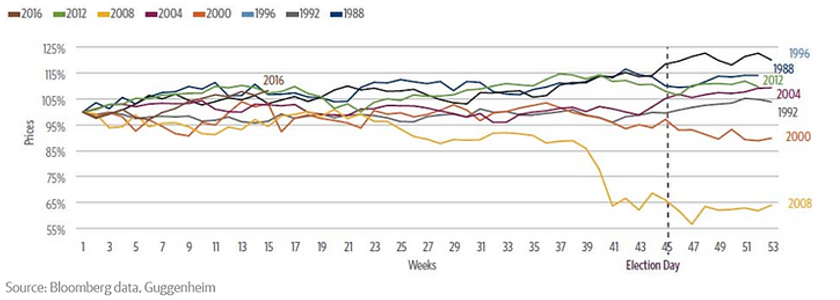
Broadly speaking, recent history shows market returns during presidential election years have been pretty good…

Source: Bloomberg, Guggenheim
The above graph shows S&P 500 returns for every election year since 1992. Aside from 2000 (tech bubble) & 2008 (Great Financial Crisis), U.S. equity returns have been positive.
Going back further, since 1928 there have been 23 presidential elections. Only four of those 23 elections experienced a loss in the S&P 500 (source: Fortune.com, Ben Carlson 8/6/2019).
If President Trump were to win the election (the most likely scenario today), history would indicate that as a positive for financial markets.

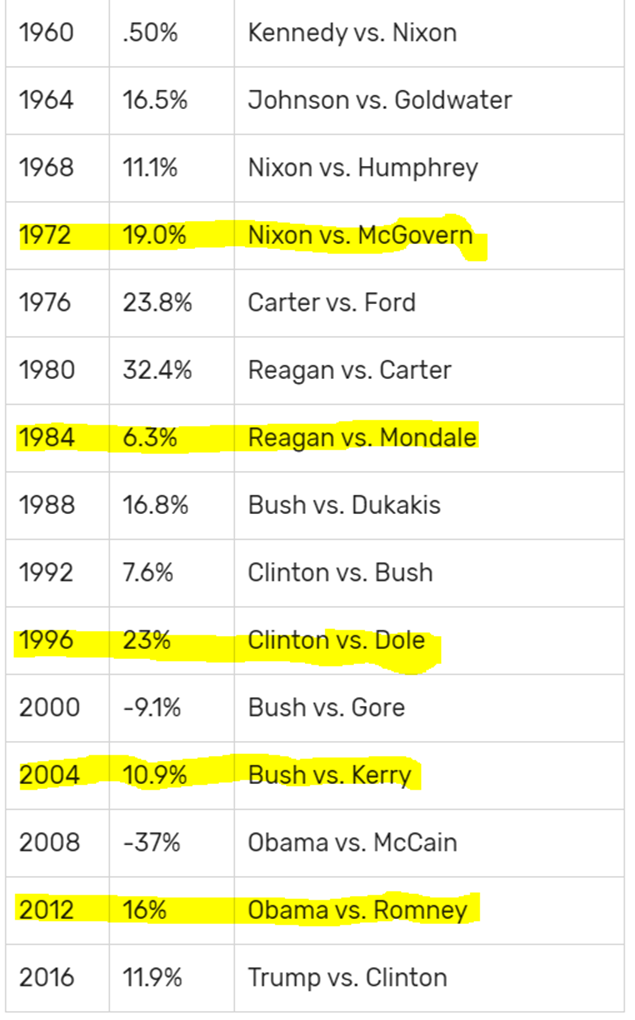
Source: The Balance
The above graph shows S&P 500 returns when the incumbent is reelected. Since 1960, there have been five instances of the sitting president winning and every year saw positive returns (yellow highlights). This doesn’t mean 2020 will follow suit, but may suggest worries about election years tend to be overblown.
What if the incumbent president loses? Our sample size is small, but again the historical data is not catastrophic (it’s actually quite good!).

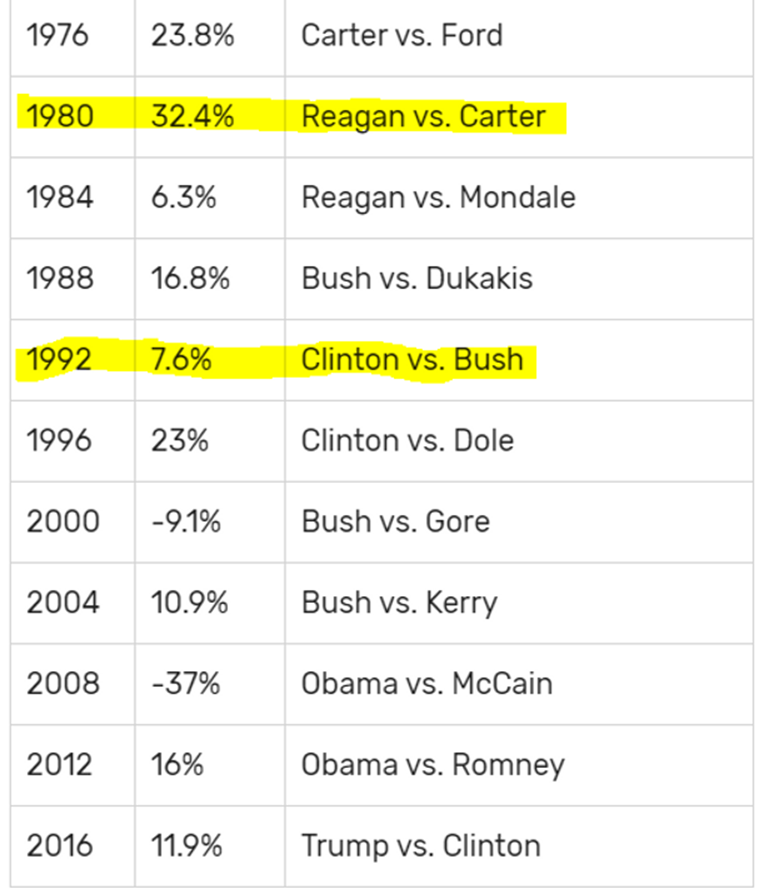
Source: The Balance
The above graph shows S&P 500 returns when the incumbent president loses the election. We are careful not to draw absolute conclusions since our sample size is small- both 1980 and 1992 saw positive returns during the transition (Dem to Rep in 1980, Rep to Dem in 1992).
If you want to pay attention to something, watch the S&P 500. In the 23 presidential elections since 1928, 14 were preceded by gains in the three months prior. In 12 of those 14 instances, the incumbent won the White House.
In seven of eight elections preceded by three months of stock market losses, incumbents were sent packing. Exceptions to this correlation occurred in 1956, 1968 and 1980. According to Stack, the S&P 500 has an 86.4% success rate in forecasting the election.
The below quote is from our blog on May 26th, 2017:
Historically, investors overestimate the impact of political parties, Presidents, and legislation. It’s reasonable to assume this premise is amplified if current government ideology conflicts with the individual investors’ political views. Even if one was to correctly forecast a political outcome, markets seldom react in a predictable manner. The globally intertwined economy is much more deep and complex than any elected government official. Mixing investing with emotionally charged politics can be hazardous to your wealth.
Presidents get too much credit when things go well and too much blame when things go sideways. There are more powerful factors at work, as James Carville famously stated, “It’s the economy, stupid.”
Share your questions and feedback on Twitter @pureportfolios or insight@pureportfolios.com
