
“Your brokerage statements suck” – Barry Glassman, Glassman Wealth
The way we consume information has been turned upside down with the internet, smartphones, social media, and the 24-hour news cycle. The digital consumption of media appeases our desire to not miss anything whether it’s our besties’ vacation or the latest political drama on Capitol Hill.
If up-to-date information is what we crave, why are we relying on stale brokerage statements to define success or failure for our investments?
Quite simply, the purpose of the brokerage statement is to prove your assets exist. There is comfort to hold a paper statement that cannot be altered, breached, hacked, or virtually stolen (unless someone is rooting around in your mailbox). It should stop there. However, too many investors misread their statements, make conclusions based off incomplete information, or give up all together and assume everything is peachy.
If you have trouble making sense of your brokerage statement, do not feel bad. They are often confusing and omit important information. We will help you filter through the noise and make better investment decisions.
What does the typical statement show?
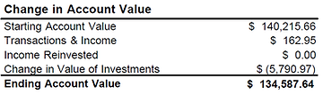
Changes in value for the period – usually displayed for a period of 30 days (monthly). If you’re lucky, the statement will include year-to-date dollar changes.
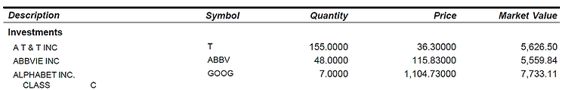
Holdings – the below snapshot is basic. Ideally, we would like to see what we paid for the asset (cost basis) and dividend yield/income.
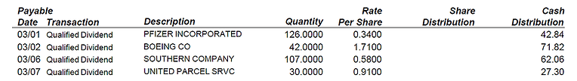
Income – dividends/interest income payable or received.
You will see variations of the above for every financial institution. To be fair, some investment managers do a decent job presenting information on their statement. However, the quality range is terrible to adequate. We have yet to see a brokerage statement that is outstanding.
Perhaps more important than what’s on your brokerage statement, is what is not included.
Performance + Benchmarks – how can we measure success or failure when the scorecard is missing? A recent Dalbar study found 78% of brokerage statements lacked any type of rate of return reporting (this isn’t an accident).
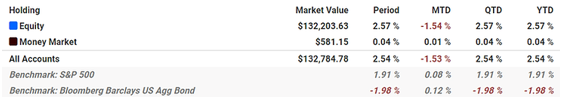
*You will never see a net of fee performance report, including benchmarks, like the above on your statement. Note: this is net of fee performance from the Pure Portfolios client portal. Clients can drill down to the asset class and individual holding level to see what’s driving or detracting from performance.
Fund Expense Ratios – the least transparent cost that exists when investing. If you own mutual funds, this expense could be siphoning off 0.50% – 2% of your assets every year. Wouldn’t you want to know what’s eating away at your principal?

Fees + Commissions – some statements do a fair job of disclosing management fees, but they’re usually buried near the back of the document. What you will not see is how much your broker made from investing in ‘A’ share mutual funds with a 5.75% up front sales load, the commission generated for buying a structured note, or the quarterly kickback the broker receives for using a particular mutual fund family.
Risk Metrics – referencing our popular post on “Naked Performance“, understanding the risk you are taking to generate returns is a huge part of the equation.
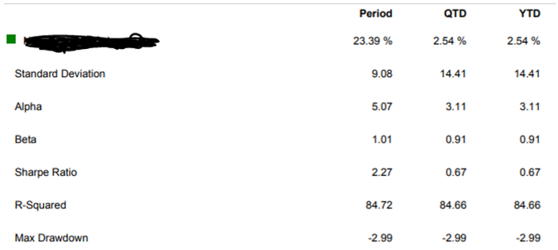
*The above report shows risk and how efficient the portfolio was relative to its benchmark. Note: this is a sample report from the Pure Portfolios’ reporting software.
In our opinion, transparency is king. If you insist on receiving a paper statement, make sure your are using it for its original purpose: to have a tangible record that your assets exist.
The scorecard of your investments should be available via a robust client portal. You should have 24/7 access to net of fee performance, account activity, asset allocation, and holdings. If your investment manager falls short or cannot provide the information you seek, it’s time to find a new advisor.
*Past performance is not indicative of future results and there is no guarantee the models will continue to perform as reflected herein. Pure Portfolios may elect to change their investment strategies and/or model allocations at any time without the prior consent of its investors. Performance contained herein is for each model as a whole, Individual client results may vary due to timing of investment, tax efficiency, legacy holdings and overall investment objective.