
The current tightening cycle has so far been reminiscent of its mid-2000s counterpart. At the time, Federal Reserve Chair Alan Greenspan had characterized the fall in long-term yields as a “conundrum”. – Bank for International Settlement (BIS) December 2017 Quarterly Review
The Fed has hiked interest rates three times since 2015. Headlines have run rampant that Fed interest rate hikes must equal bond yields moving higher. The consensus predicts bond prices will be crushed.
Bond Bubble Brews as Central Banks Retreat from QE– Financial Times 7/23/2017
Greenspan Warns of Bond Market Bubble– Bloomberg 7/31/2017
US Hedge Fund Warns of ‘Biggest Bond Bubble in History’– Telegraph UK 8/19/2016
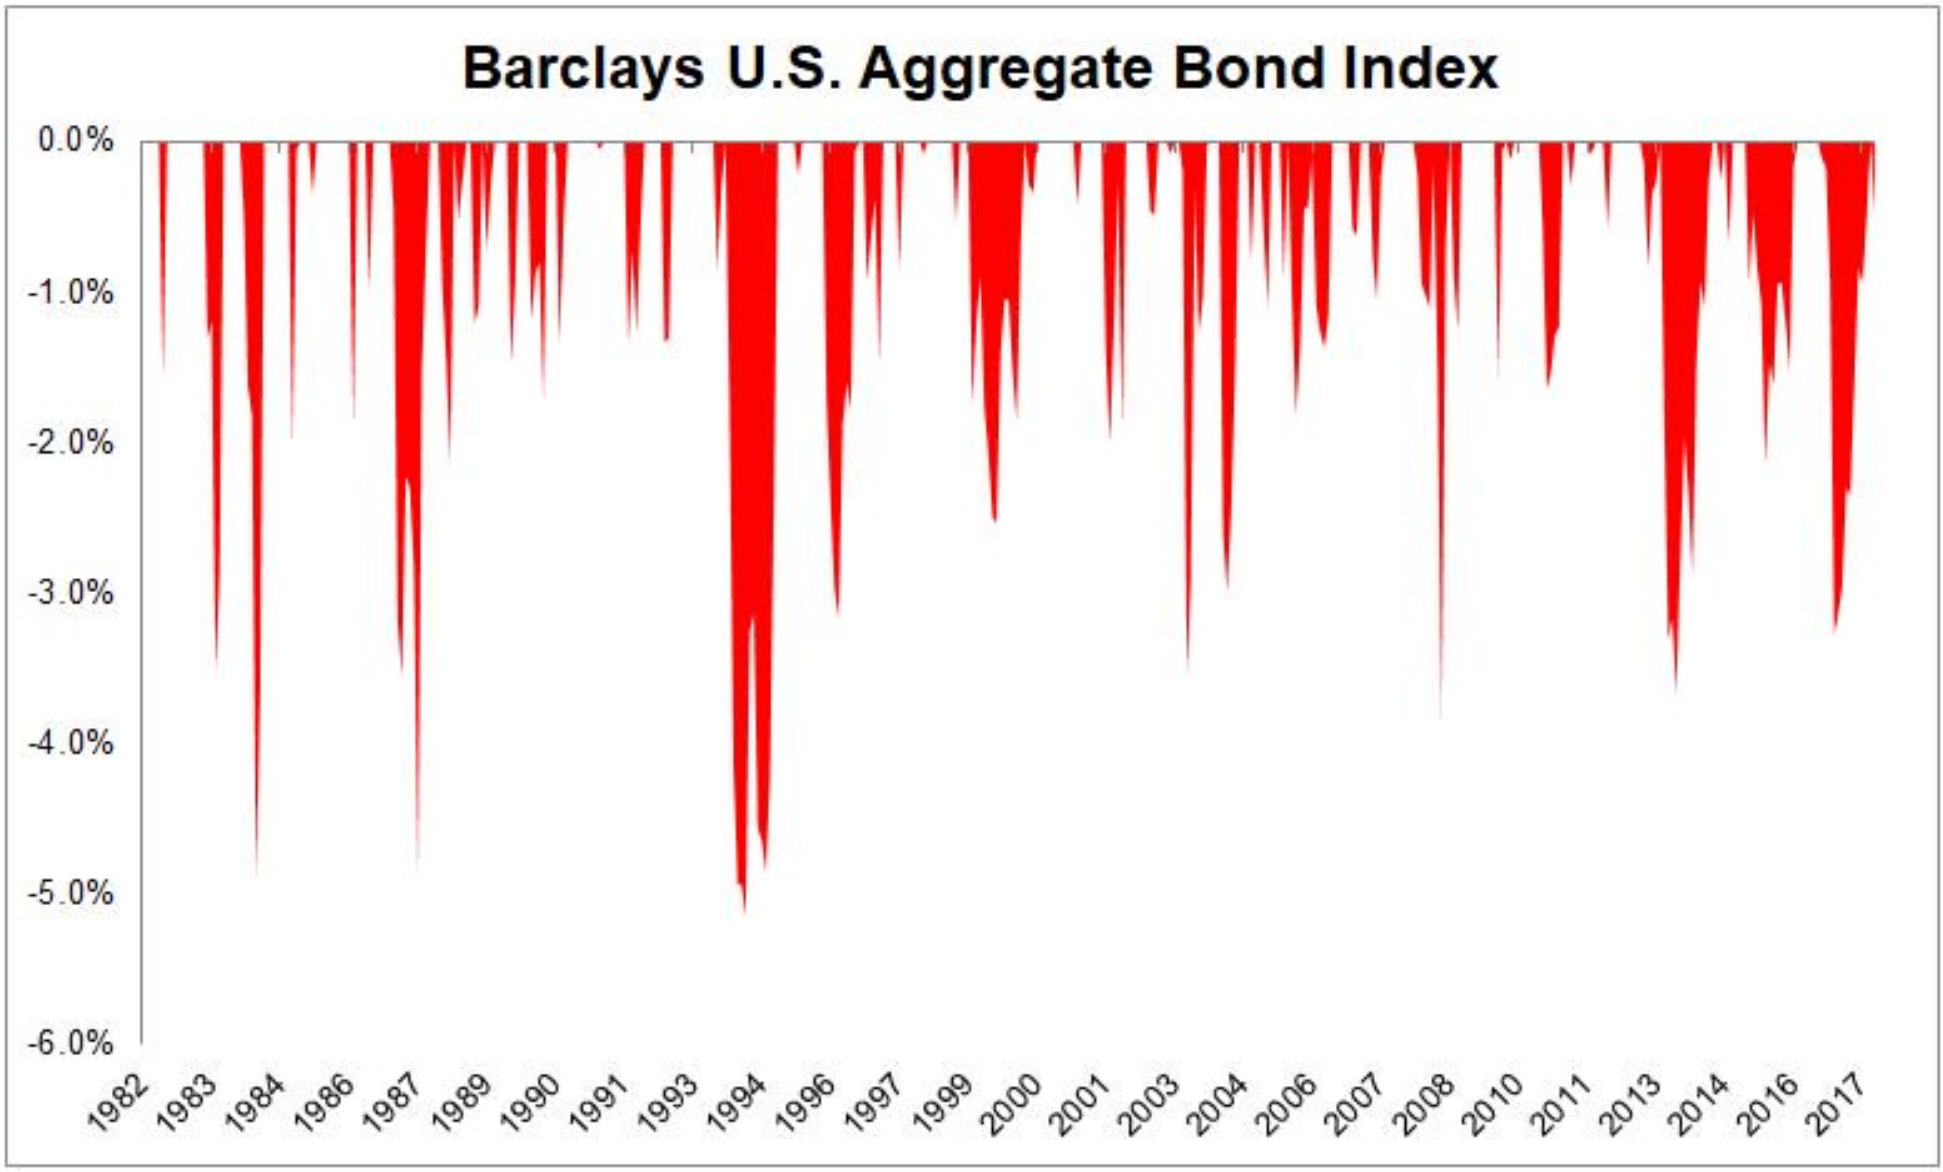
This is a small sampling of the bond market fear mongering. We could go on all day (see Google Bond Bubble for a Laugh). Never mind the biggest bond drawdown in the last 30 years is 5% (mid-1990s).
The rising bond yield narrative is expressed in advisor-managed portfolios & do-it-yourself investors with a heavy overweight to short-term bonds. The theory goes, if yields rise, investors can reinvest proceeds at the new higher rate as short-term bonds mature. This theory is widely accepted as sound portfolio management, however, yield curve shifts are seldom neat and tidy.
As we have written here and here, the relationship between Fed funds and bond yields is complex. In our opinion, fixed income is the most misunderstood asset class on the planet. It’s also where avoidable portfolio management mistakes often occur (see Mismanaged Bond Portfolios Are Costly).
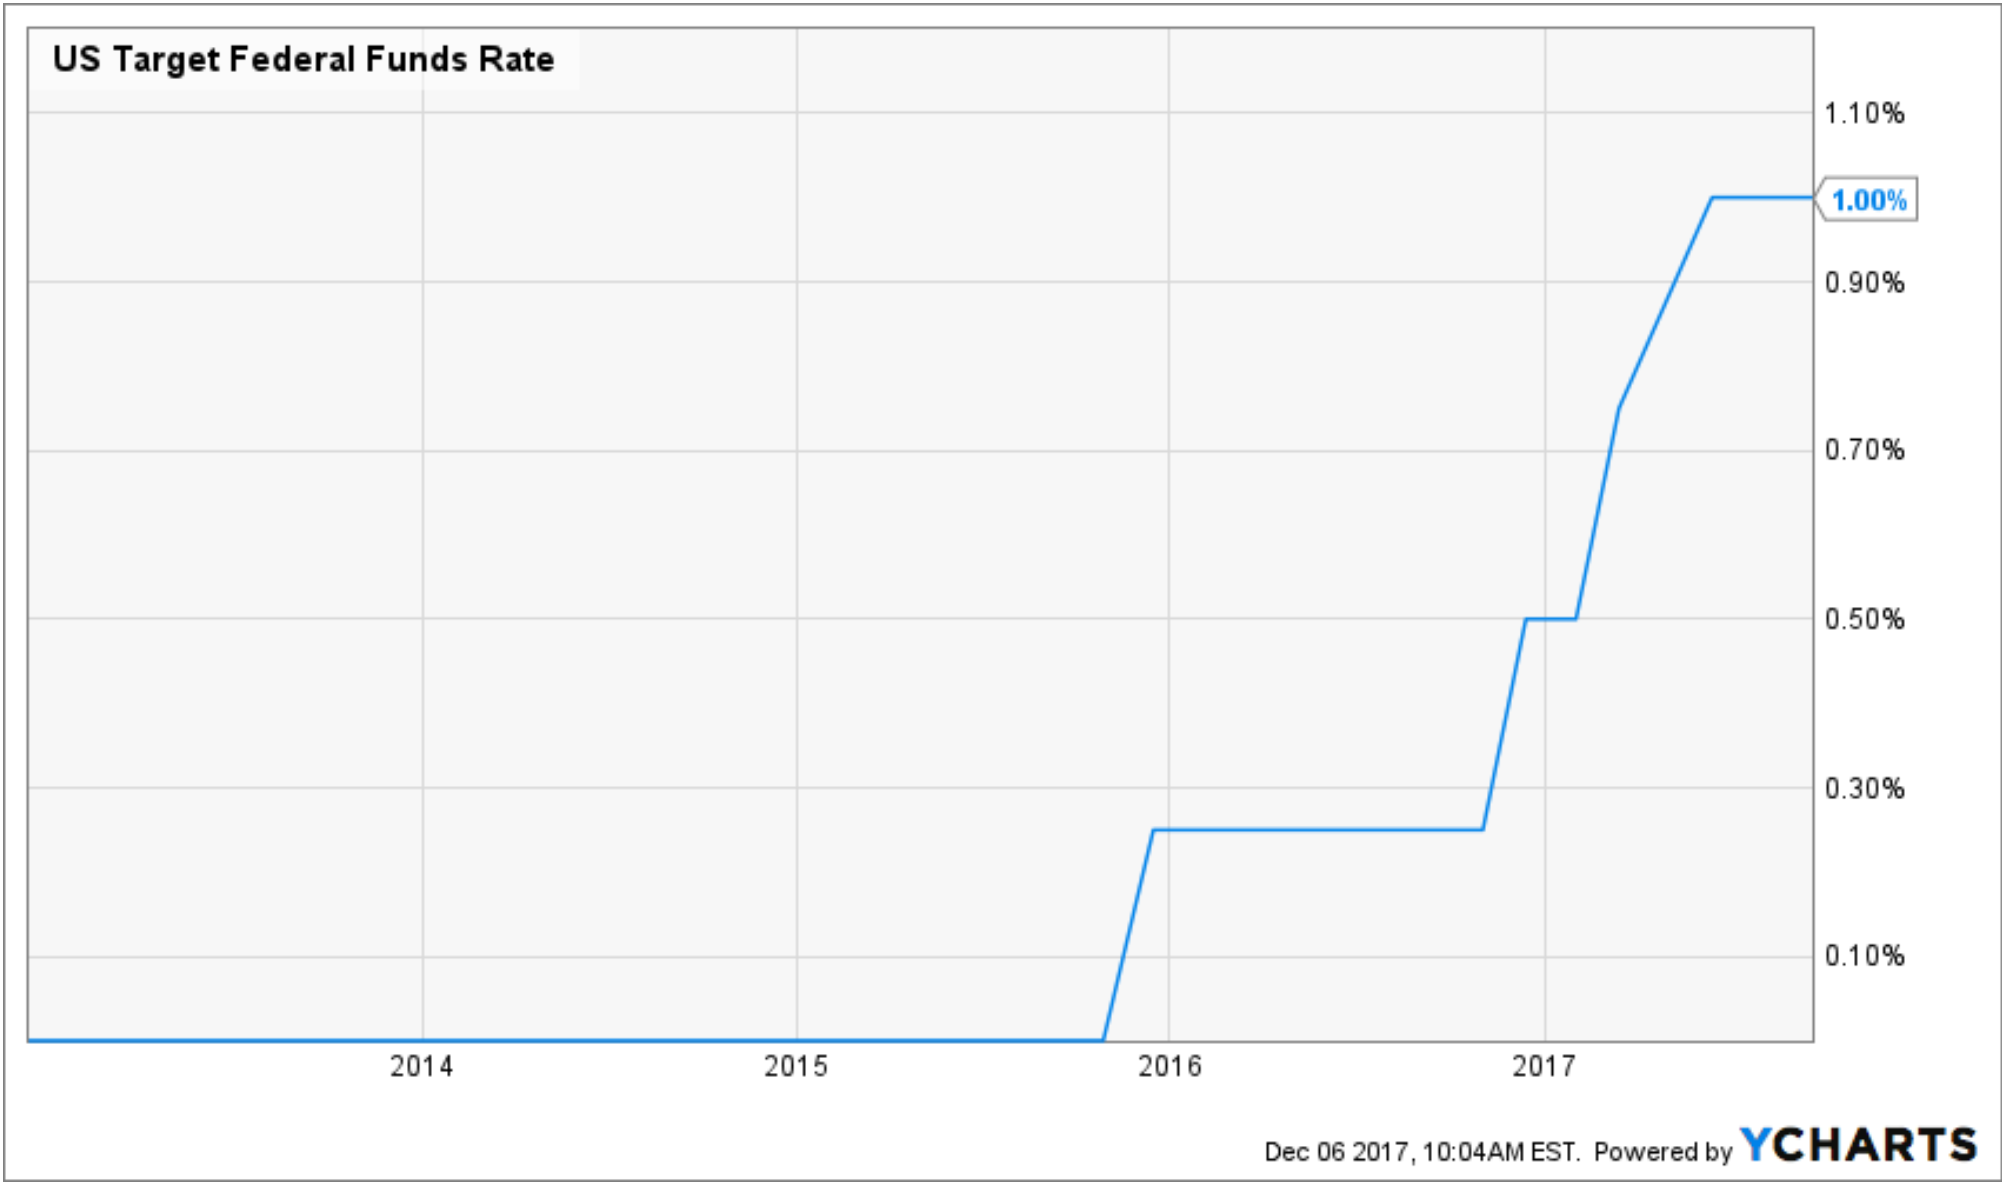
The Fed’s first hike in 2015 started a slow “normalization” of short-term interest rates.
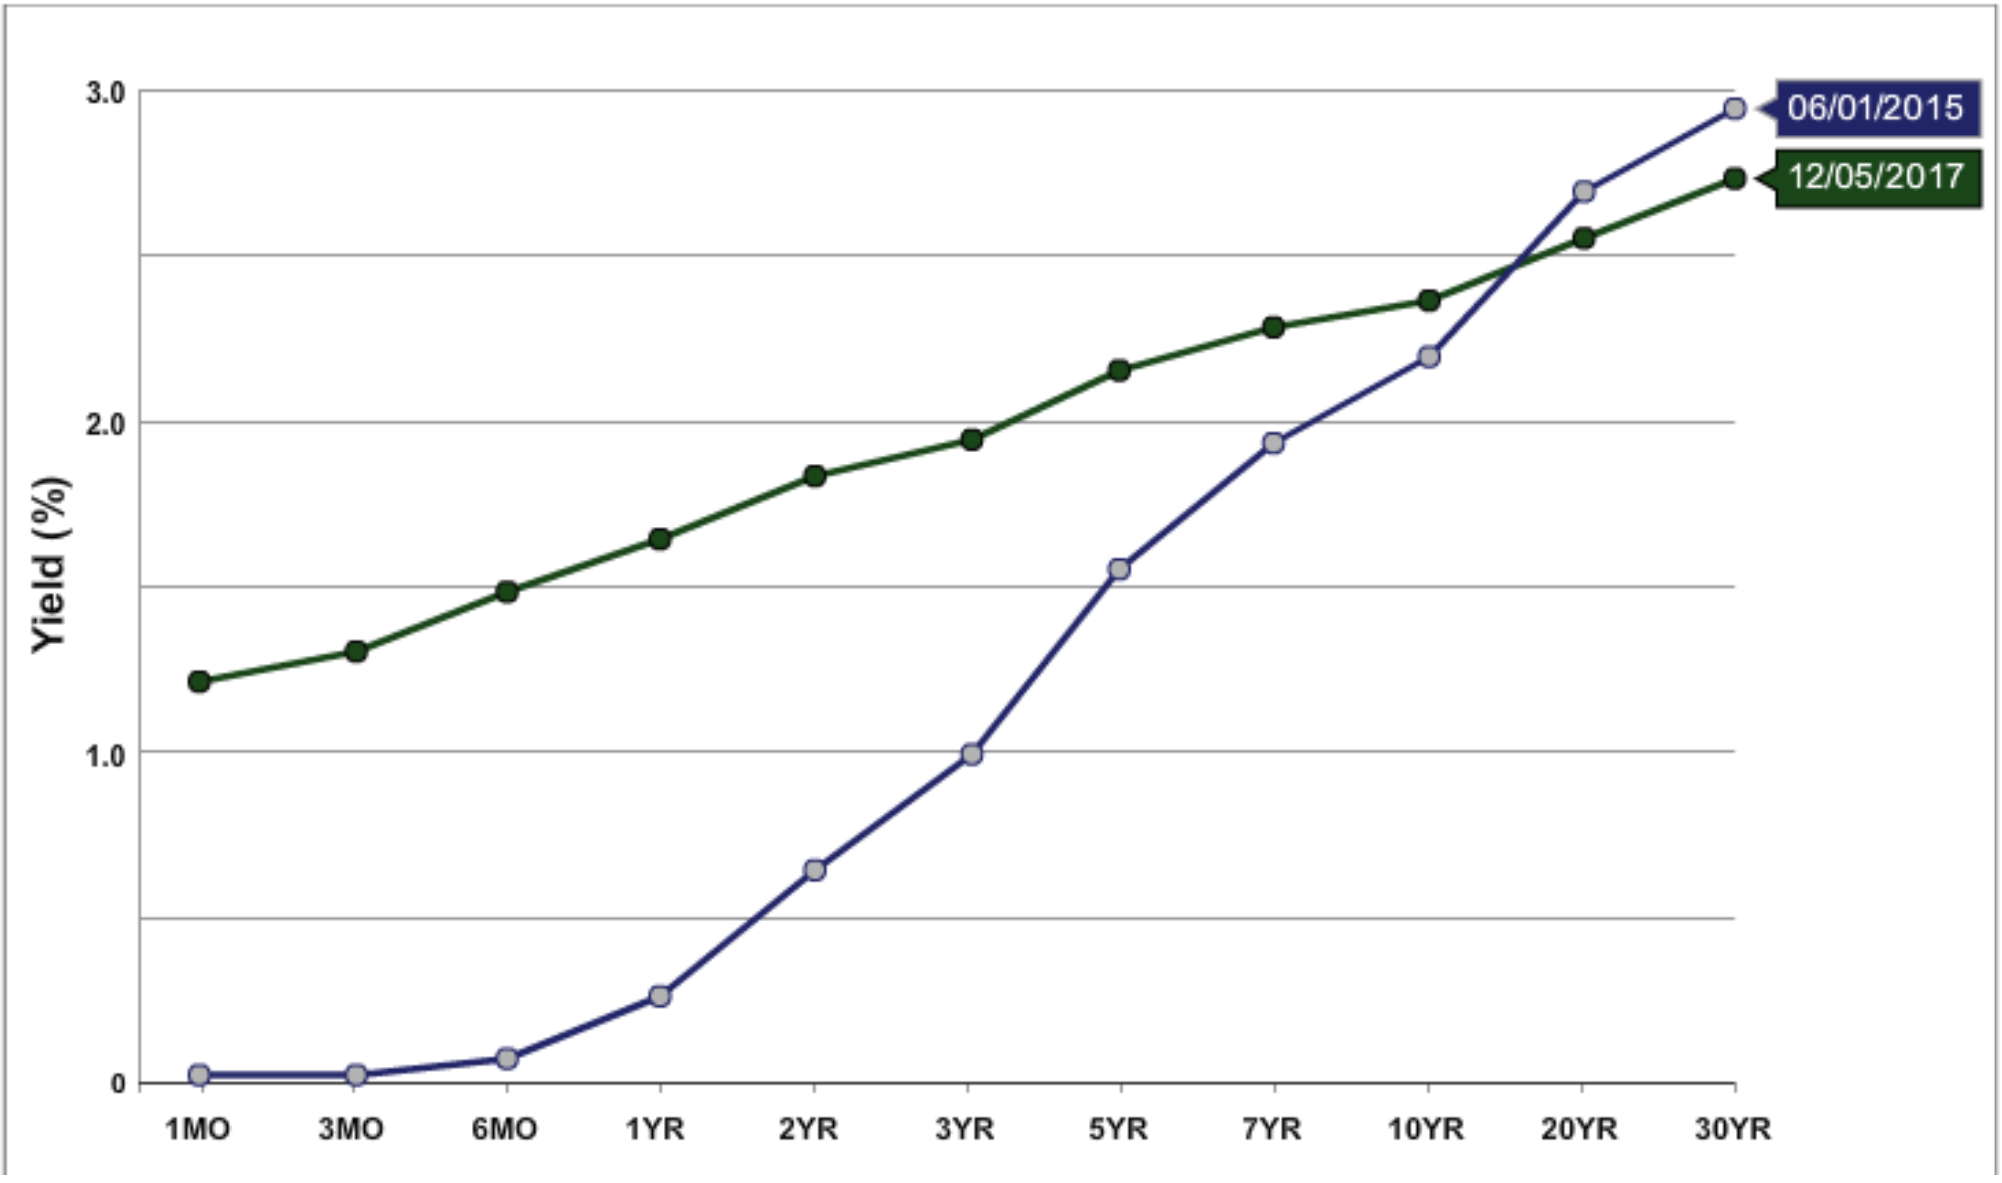
Source: US Treasury, 6/1/2015 Yield Curve (blue) & 12/5/2017 Yield Curve (green).
Notice the Fed influence on the front-end of the yield curve. It’s moved up pretty much in lock-step with Fed interest rate increases. As we wrote back in 2016, the long-end of the yield curve doesn’t care what the Fed is doing. Longer term bond yields (20+ years) care about growth and inflation. Both are stubbornly low by historical standards. This rate hike cycle is playing out much like 2004-2006, albeit a much slower pace of increases from the Fed.
Unfortunately, most advisors and do-it-yourself investors have plowed into the front-end of the yield curve allocating to shorter-dated bonds. Essentially, they have gone down with the herd and missed a great opportunity in longer-maturity bonds.
*Time period of the below graphs is 6/1/2015 (pre-Fed hike) to 12/5/2017. We are only showing the % price change of the bonds. Our case is bolstered even further when we include coupon payments. Longer dated bonds typically pay higher coupon payments.
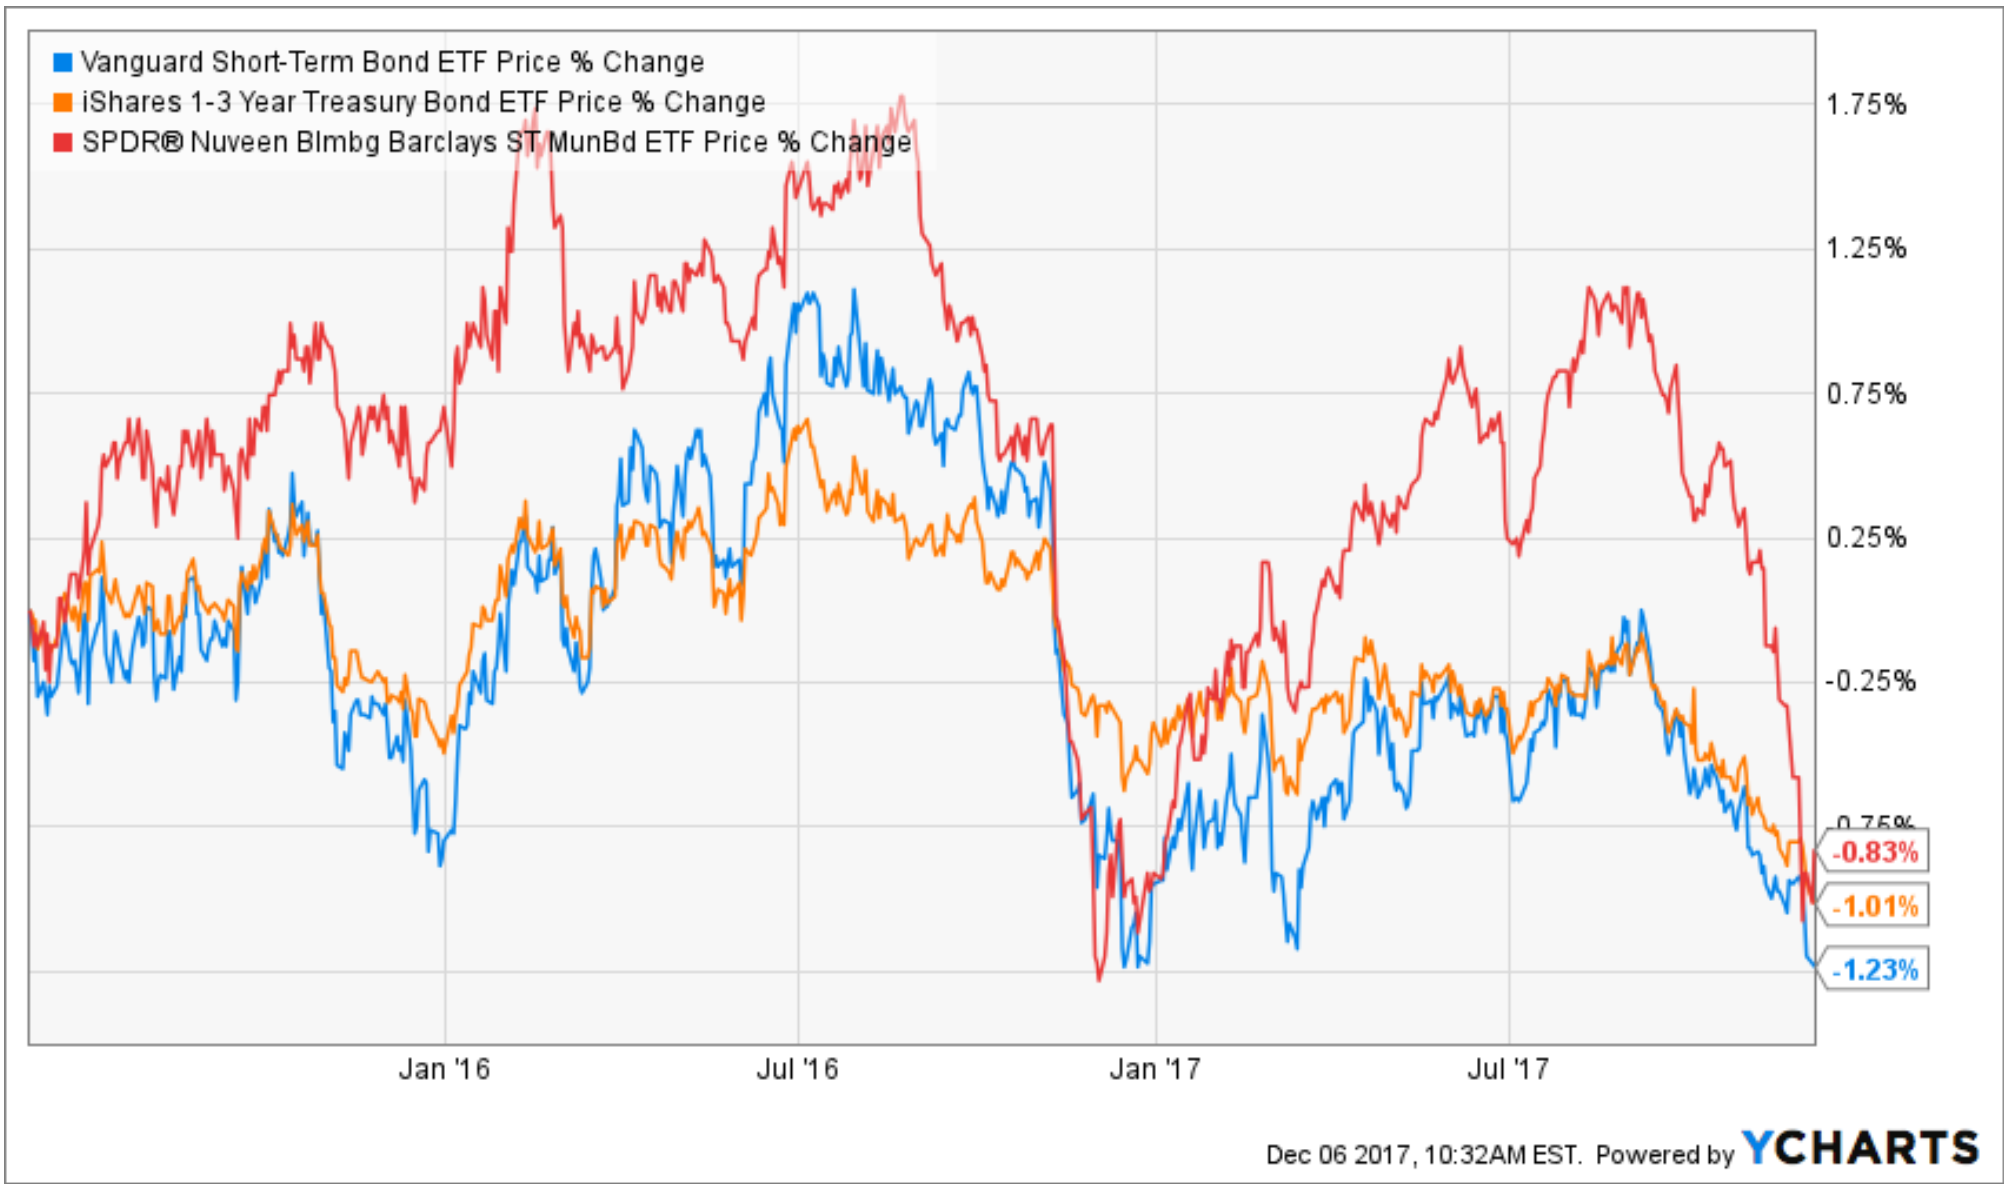
The above graph shows negative price movements for short-term fixed income across corporates (blue), U.S. Treasuries (orange), and municipals (red).
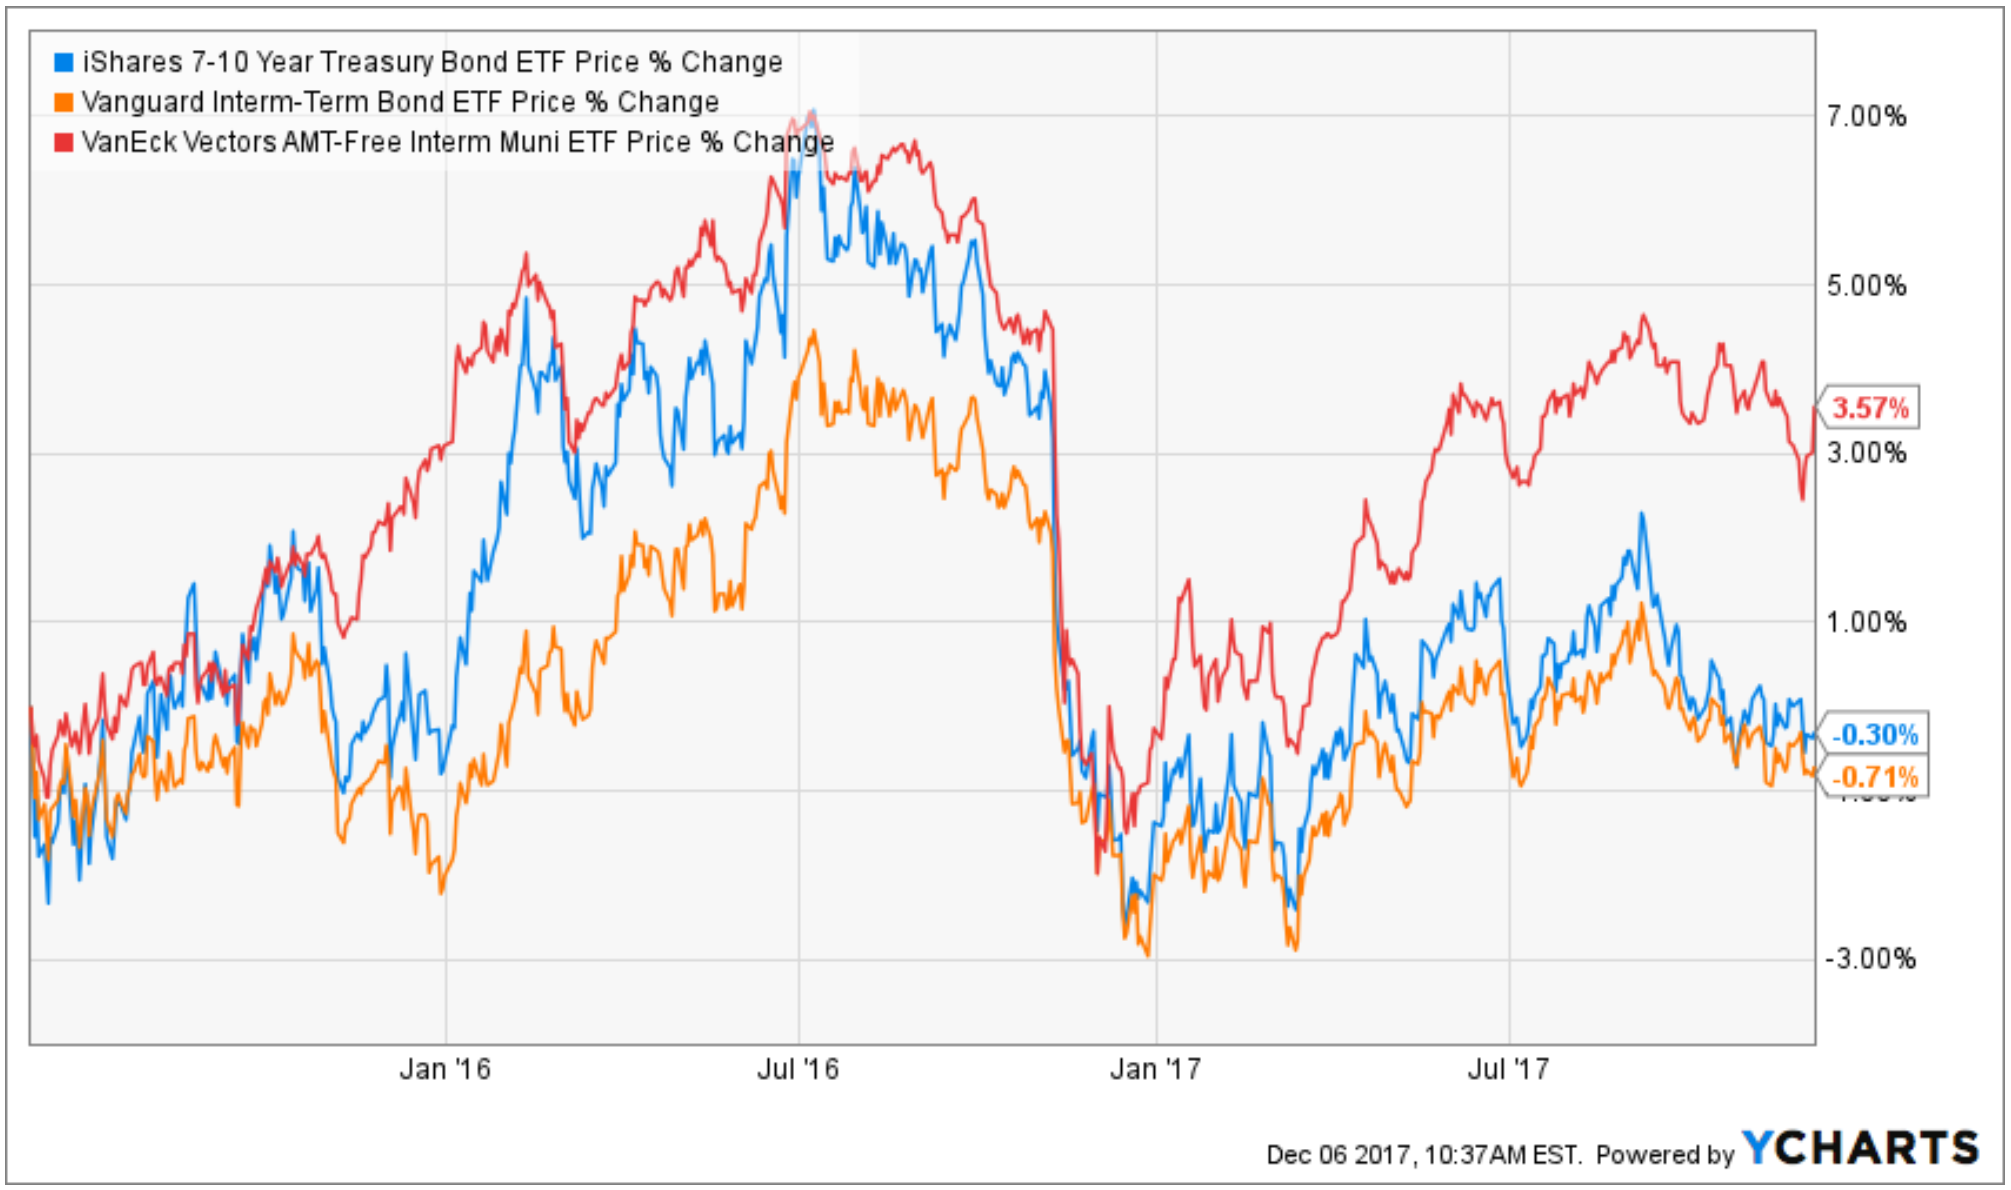
Intermediate term bonds, maturities ranging from ~7-10 years, have fared slightly better. Municipals (red) have posted the best performance.
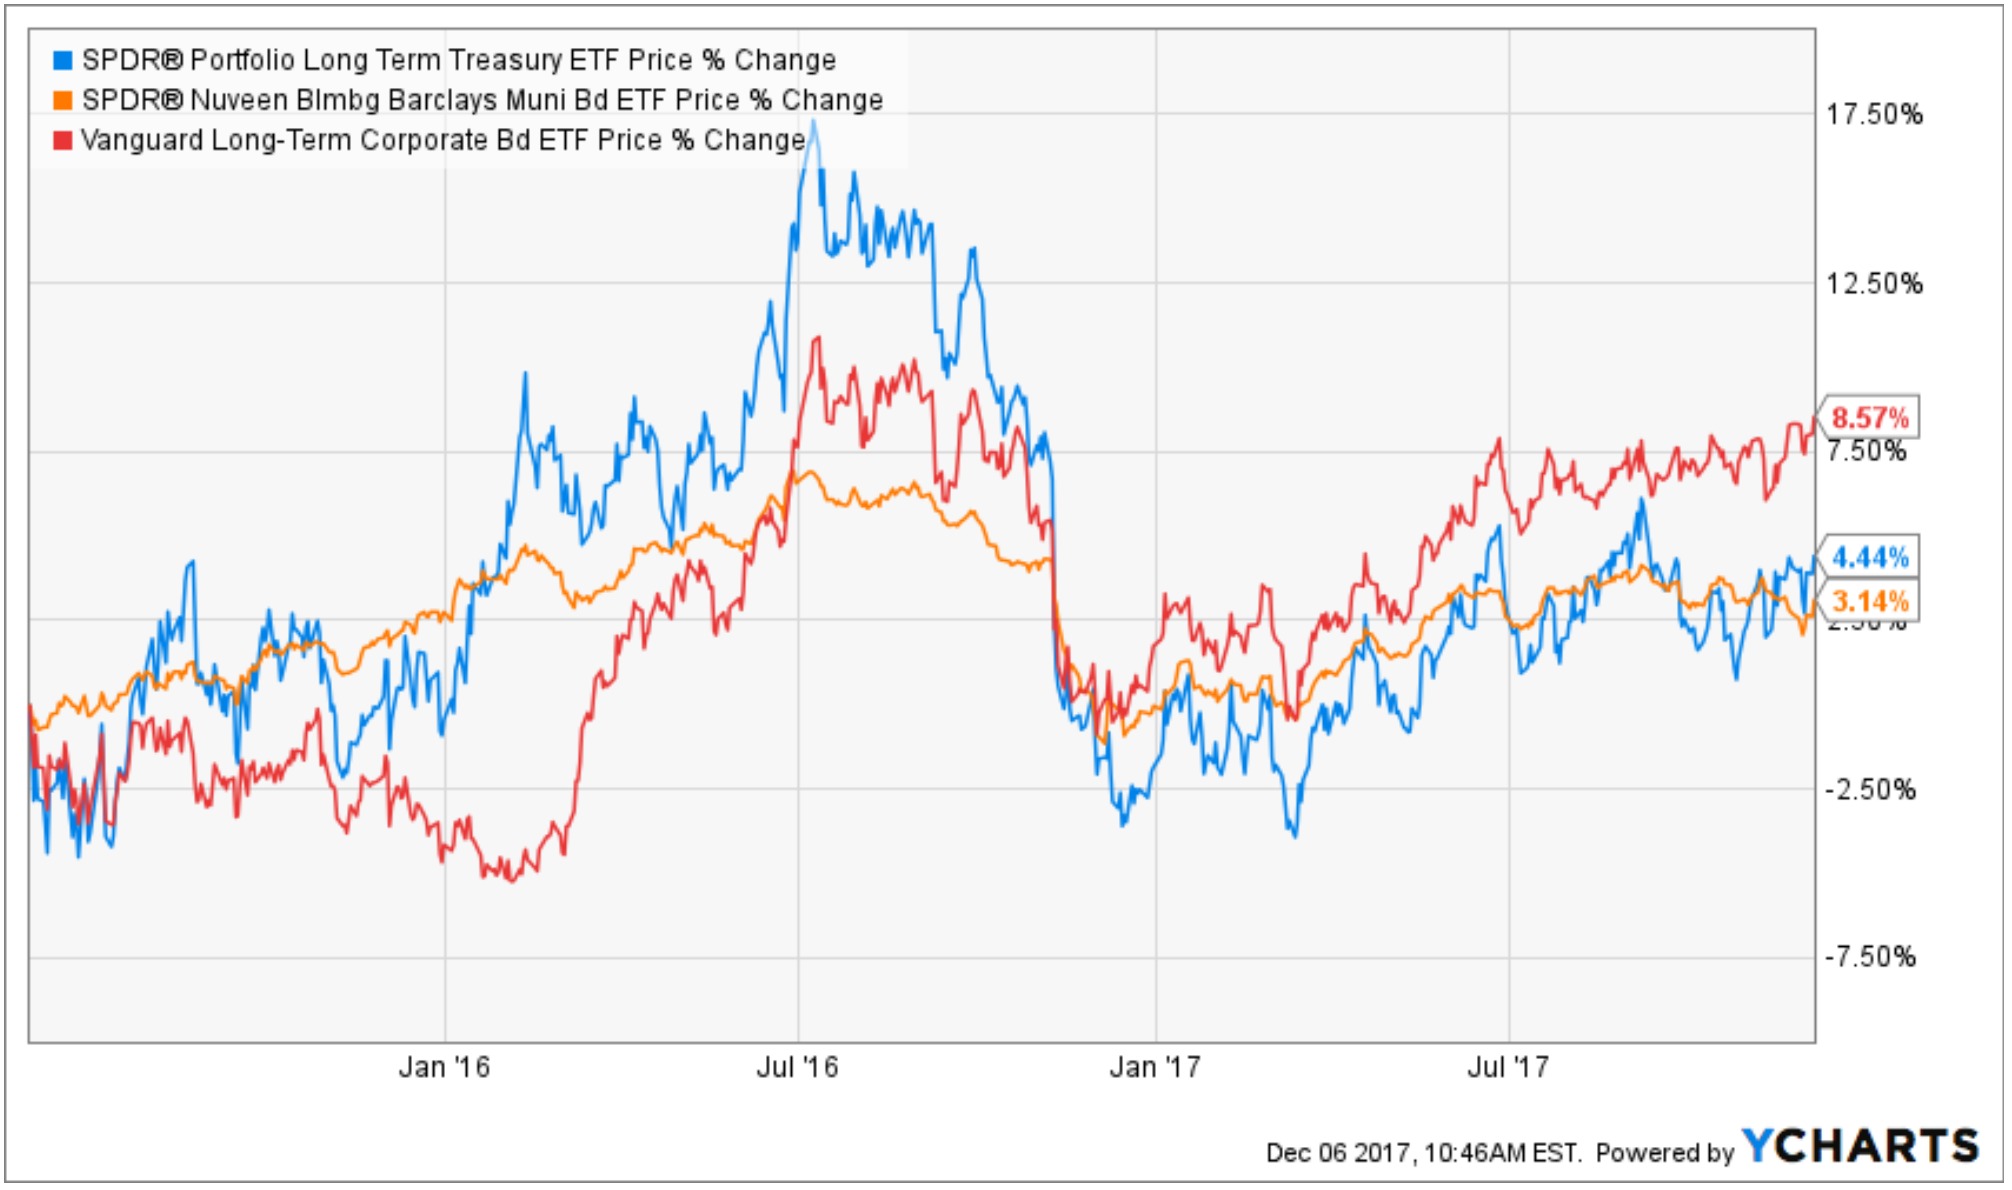
Investors willing to go against the herd have been rewarded handsomely. Long-term bonds across styles (Treasuries, corporates, and munis) have generated solid performance and higher investment income.
We are not implying investors should shun short-term bonds for current obligations, but outsized positions in bonds maturing within 1-3 years has been an awful trade. In our opinion, it’s the equivalent of moving 30% of your equity holdings to cash because the market must crash. Bond investors have forgone excess performance, investment income, and a natural hedge within their portfolio by not allocating to longer-dated bonds.