
In response to the financial crisis, investment managers scrambled to find alternative strategies to soften total portfolio risk during extreme market drawdowns. Hedge funds, with their historically low correlations to equities, seemed like a logical solution. However, most of the investing public did not have access to the exclusive hedge fund space. The Wall Street profit machine changed that with the introduction of mutual funds that mimicked hedge fund strategies to give the retail investor a chance to participate.
Fast forward to 2017, equity markets have been on a slow melt-up and volatility has been virtually non-existent. Hedge funds have received universal flack for high fees and underperformance. The hedge fund industry responded by adding exposure to the very asset class they’re supposed to hedge i.e. buying equities to chase performance.
The hedge fund marketing story is still relevant…add assets that reduce total portfolio risk. This makes sense, you want assets that act differently. It doesn’t do any good to own 10 different asset classes if they all behave the same way during times of market stress. We agree with that. Being an evidence-based investor, our job is to make sure the story aligns with the results. In other words, are hedge funds doing what they’re supposed to do? There are over 10,000 direct investment hedge funds, some do their job well and may be worth the 2% fee and 20% of profits. However, the top quartile funds are inaccessible. The average investor is left with mutual funds that mimic hedge funds, which in our opinion, has been an epic fail.
Correlation: Statistic that measures the degree to which two securities move in relation to each other. A perfect positive correlation means that the correlation coefficient is exactly 1. This implies that as one security moves, either up or down, the other security moves in lockstep, in the same direction. A perfect negative correlation means that two assets move in opposite directions, while a zero correlation implies no relationship at all. Source: Investopedia
We are interested in how the S&P 500 moves in relation to a broad hedge fund index (which is supposed to replicate various hedge fund strategies). We have evaluated two time periods: June of 2008 to end of 2009 (crisis) and January 2013 to June 2017 (post-crisis). We use ticker SPY to represent the S&P 500 and GJRTX Goldman Sachs Absolute Return Tracker fund as the broad hedge fund index. Each position will have a 50% weighting. To compare the effectiveness of the hedge fund portfolio, we combine SPY with BND Vanguard Total Bond Market ETF as Portfolio 2.
Crisis: June 2008 – December 2009
Portfolio 1: SPY (50%) & GJRTX (50%)

Assuming a 10% decline in the S&P 500 using the correlation from the crisis period of 0.54, our $200,000 starting portfolio value would now be:
$90,000 SPY + $ 94,600 GJRTX = $184,600
Portfolio 2: SPY (50%) vs. BND (50%)

Assuming a 10% decline in the S&P 500 using the correlation from the crisis period of 0.03, our $200,000 starting portfolio value would now be:
$90,000 SPY + $99,700 BND = $189,700
Post Crisis: January 2013 – June 2017
Portfolio 1: SPY (50%) vs. GJRTX (50%)

Assuming a 10% decline in the S&P 500 using the correlation from the post-crisis period of 0.88, our $200,000 starting portfolio value would now be:
$90,000 SPY + $91,200 GJRTX = $178,000
Portfolio 2: SPY (50%) vs. BND (50%)
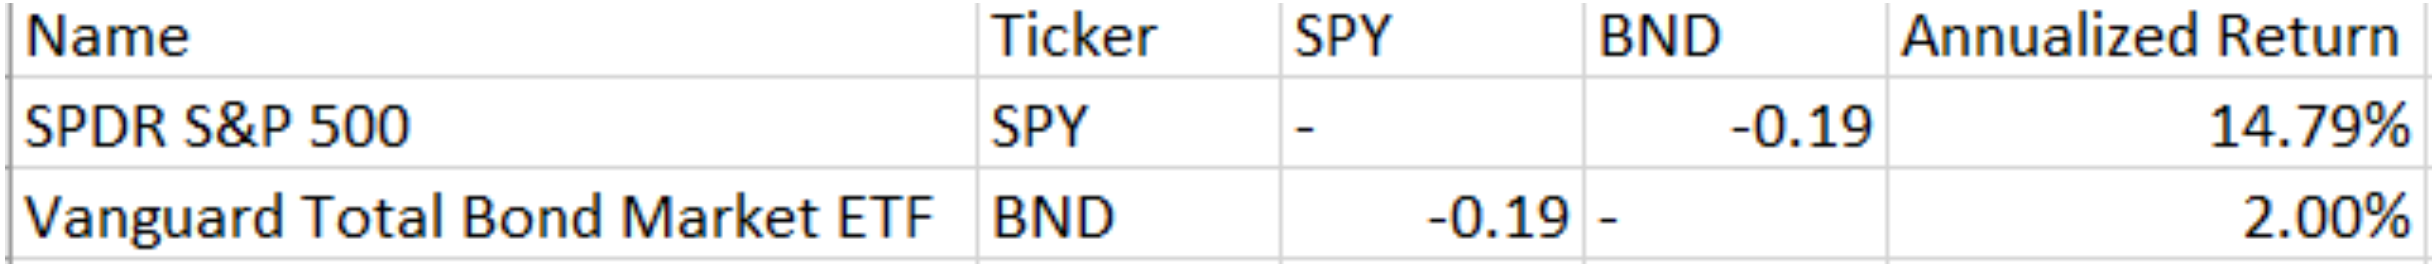
Assuming a 10% decline in the S&P 500 using the correlation from the post-crisis period of -0.19, our $200,000 starting portfolio value would now be:
$90,000 SPY + $101,900 BND = $191,900
Note: Portfolio 1 has a blended expense ratio of 0.39%. Portfolio 2 has a blended expense ratio of 0.07%. Not only does Portfolio 1 offer poor diversification benefits, it costs 5x as much!
Looking at the above hypothetical scenarios, pre & post financial crisis, a simple low-cost bond ETF offers superior outcomes. Hedge funds have loaded up on equities to chase performance. The result is an ineffective and costly “hedge.”
Just to drive home the point, let’s look at the top 25 holdings for the Goldman Sachs Absolute Index (everything in bold is an individual stock, equity ETF, or has equity-like characteristics):
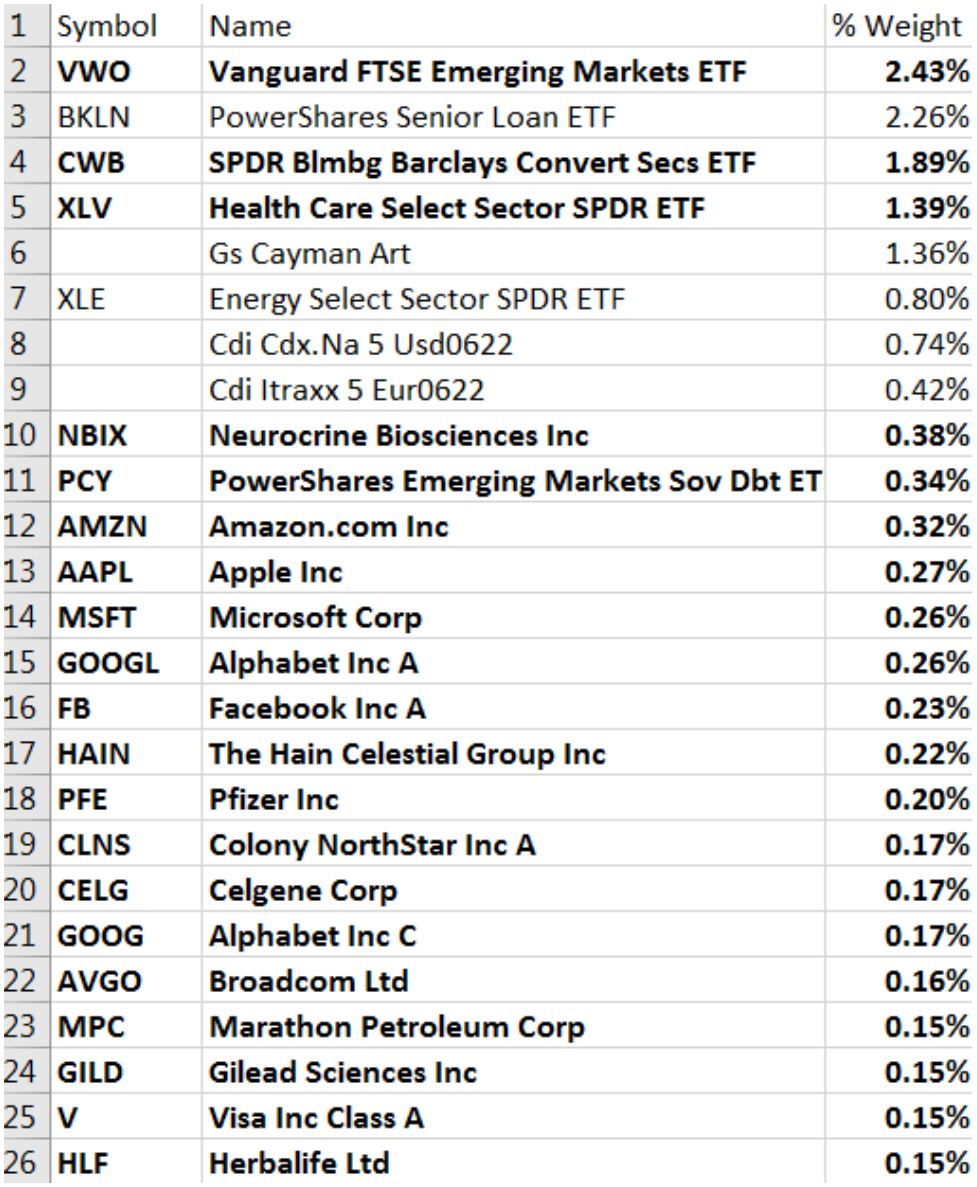
Source: YCharts as of 3/31/2017
How can you hedge equities with equities?
We concede that correlations can change over time, but this is a pending disaster.
If you own mutual funds, hedge funds, or commodities there is a cleaner way to build a portfolio that is more tax efficient, lower cost, and better structured to minimize risk.
Notes on results:
https://www.portfoliovisualizer.com/asset-correlations
Time frame for correlation analysis is the full available data range unless a specific date interval is specified.
Monthly standard deviation is calculated based on available full calendar months including the entered start and end months.
Annualized standard deviation is calculated from the standard deviation of monthly returns.
Annualized return is calculated from the specific time period using compound annual growth rate formula.