A client asked me what our crystal ball was saying after the turmoil this week. It’s impossible to know what happens next, but it did pique our curiosity.
How common are nasty pullbacks (defined by 5+% declines) over the past ten years? In other words, how often do we get chaos in the midst of a bull market?
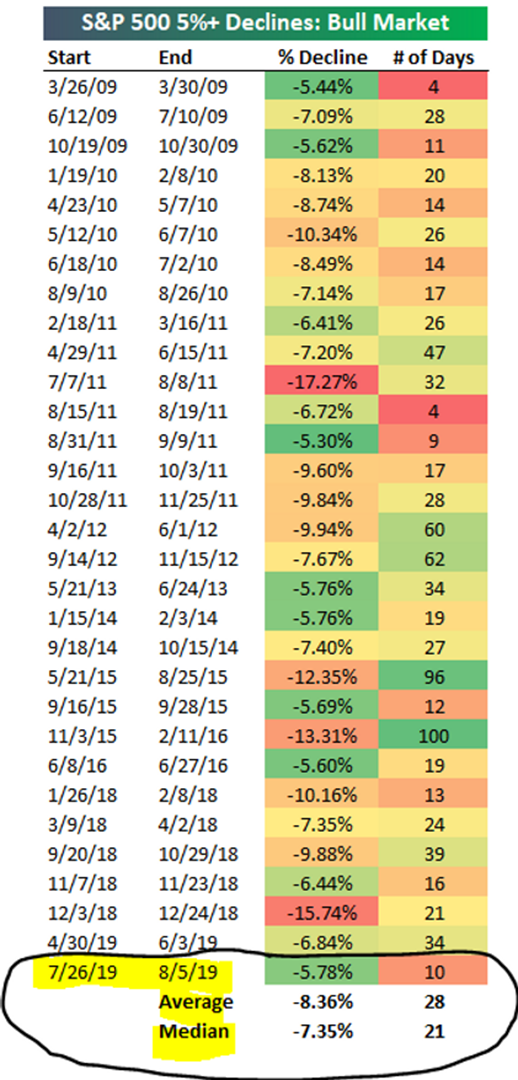
In short, “mini shocks” are more common than we thought. Since March 2009, there have been 31 instances when the market has declined 5% or more.
While the last 18 months have been hectic, 2019 is looking tame compared to recent history.
Source: Bespoke Investment Group
The above graphic shows every 5% pullback since spring of 2009. While the past ten days might seem awful, it’s tame compared to the steep 15+% down moves of 2011 and 2018. 2015 also saw two separate ~12% drawdowns that lasted over three months. At the bottom of the graphic, we can see the average pullback is -8.36% lasting 28 days. As of this writing (8/7), we are still under the cycle average for both metrics.
Source: Bespoke Investment Group
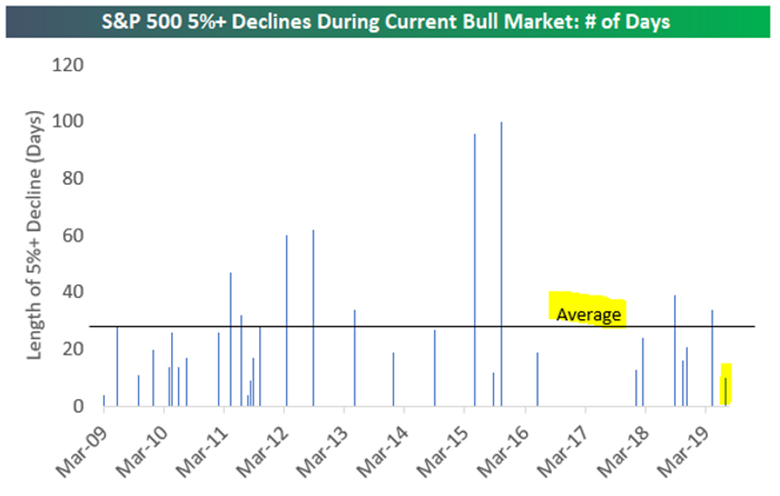
The above graph shows the number of days of 5+% declines since March 2009. The current market hiccup is ten days and counting. This is well below the average 5+% decline period of 28 days. Notice the prolonged period of pain in 2015!
Source: Bespoke Investment Group
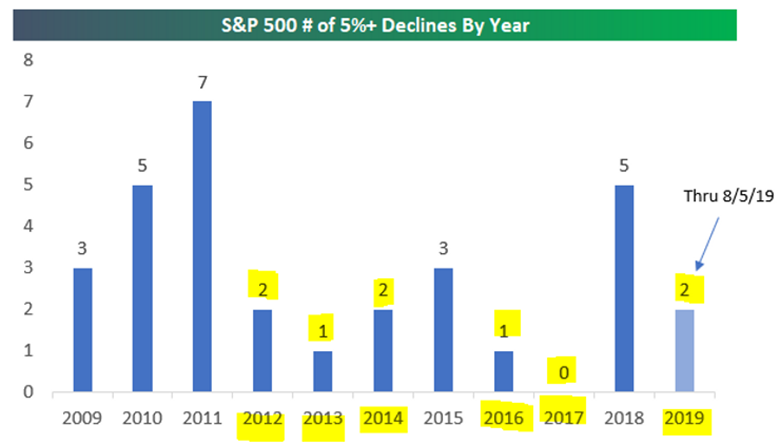
The above graph shows the number of 5+% declines by year. Since 2012, investors have been spoiled with the low frequency of 5+% market declines. Aside from 2015 & 2018, it’s been smooth sailing over the past eight years. 2017 was one for the record books, uninterrupted gains and virtually zero volatility!
Source: Bespoke Investment Group
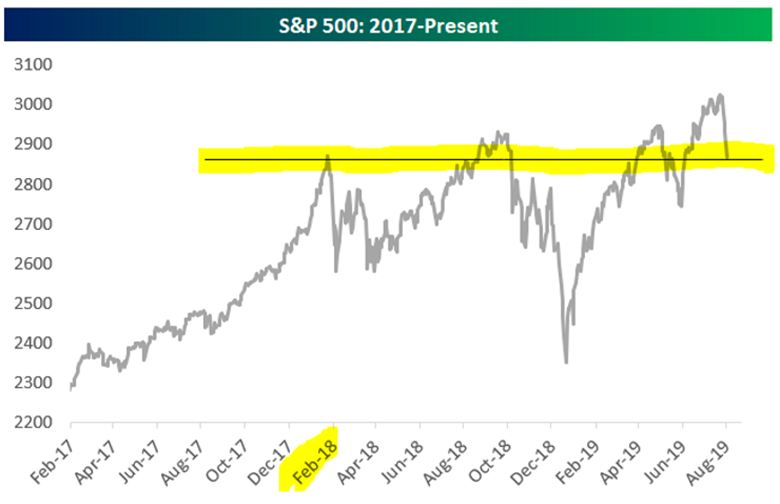
The above graph shows the S&P 500 is essentially unchanged since the beginning of 2018 (however, it hasn’t been a smooth ride). Despite all the drama of the trade war, politics, and the Fed, it’s added up to a whole lot of nothing.
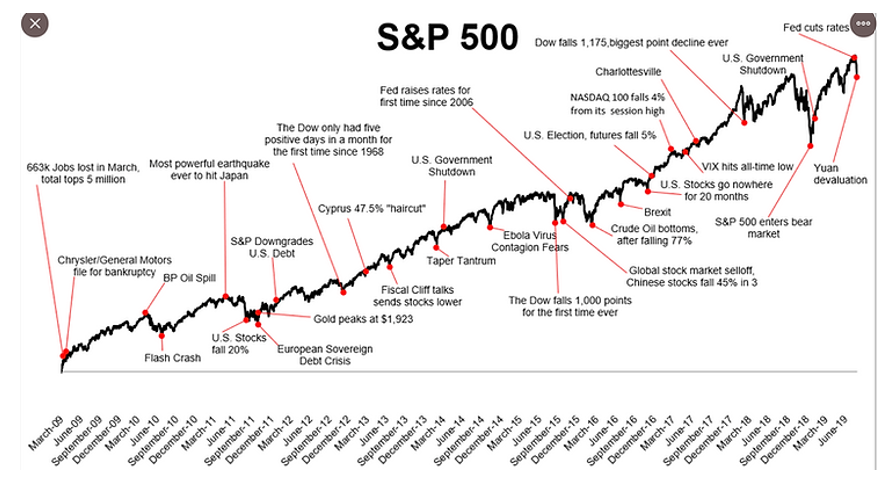
Source: Michael Batnick, Ritholtz Wealth Management
The above graphic shows the S&P 500 (black line) overlayed with “major” market events since 2009. The market has proved quite resilient over the past ten years. There will always be something to worry about, but the markets don’t care about our personal situation, beliefs, biases, or viewpoints.
Based on recent history, pullbacks of 5+% or more are quite common. Nothing about the recent pullback is extreme, or any different than the dozens of previous declines. In general, investors get so wrapped up in politics and daily market moves, things often seem worse than they really are.
We have gotten used to easy returns and minimal volatility. Investors have built up a low tolerance for pain. “Long-term” used to mean 10+ years, it’s a fraction of that today. If the latest market episode has shaken your ability to stick to your plan, you’re invested incorrectly.
Find out if your portfolio fits you by clicking here.
Share your questions and feedback on Twitter @pureportfolios or insight@pureportfolios.com
