“Gold jacket, green jacket…who gives a $%&!”– Happy Gilmore
We have heard them called foreign equities, global markets, international developed, emerging markets, frontier markets, BRIC countries. Investing outside the U.S. can be both rewarding and confusing.
We aim to provide insight around two common equity assets classes: international developed & emerging markets.
We feel this is timely given that many investors, including Pure Portfolios, see more opportunity abroad to satisfy future return expectations.
After reading this you’ll have a better understanding of what you own, what countries make up international & emerging market indices, currency impact on performance, cost, liquidity, and sector exposures. This week, we will focus on the International Developed markets (next week’s blog we delve further into emerging markets).
International Developed– Mature economies measured by GDP and per capita income. Often more stable economic cycles and advanced infrastructure. For investment purposes, Australia, Canada, France, Germany, Japan, and the U.K. would be examples of an international developed country.
Emerging Market – Developing economies measured by lower GDP and per capita income. Often more volatile economic cycles and lack dependable infrastructure. For investment purposes, China, India, Brazil, Russia, Turkey, and Vietnam would be examples of an emerging market country.
For the below examples we use the SCHF Schwab International Equity ETF and SCHE Schwab Emerging Market Equity ETF. However, you can run a similar analysis for any foreign equity ETF (you just need the ticker symbol).
Schwab International Equity ETF aka “International Developed”
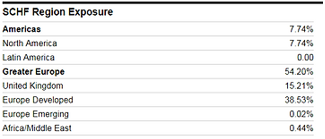
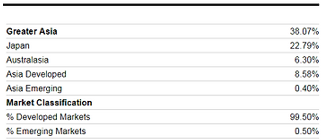
The above graphic shows a heavy allocation to greater Europe (which includes the U.K.). You can also see Japan, Australia, and developed Asia (Indonesia, South Korea, and Taiwan) well-represented. Canada is the lone North American country.
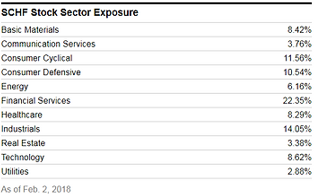
It’s important to understand sector weights. For example, one might have an aversion to banks only to find out the ETF you own has a ~22% weighting to financial services.
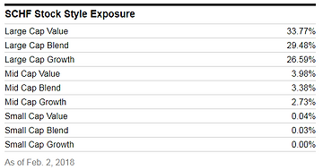
Most international developed ETFs own primarily large companies. Since we are buying an index, it makes sense the style (Value, Blend, Core) is well-balanced.
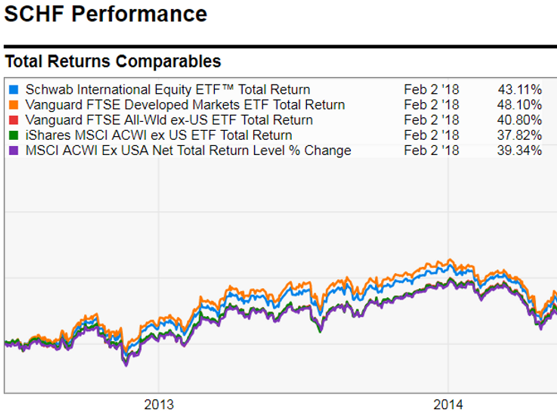
We like to understand how our International Developed ETF moves in relation to peers and the benchmark. If there is a large deviation, chances are the composition of the ETFs are different. It’s okay to deviate from the benchmark, but you should understand what’s driving the discrepancy.
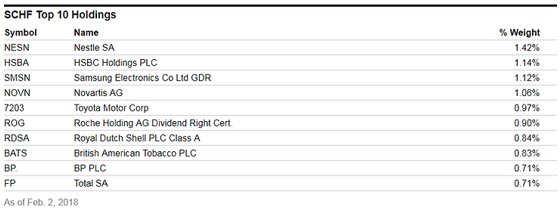
Top holdings make ETFs more real. Remember, you are buying a basket of individual securities under a much more investor-friendly umbrella (low cost, tax efficient, liquid)!
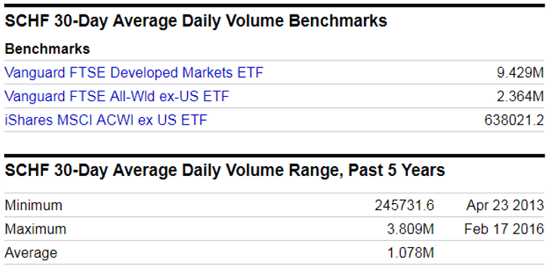
We want to know our ETF can readily be sold if we need to raise cash. We pulled three international ETFs (top graphic) and compared them to the Schwab International ETF on a volume basis. As a general rule, the higher the volume, the easier and cheaper we can sell our ETF.
Speaking of cost, not all international ETFs are created equal:
For example, the iShares MSCI EAFE ETF (EFA) is a popular international developed ETF, but its expense ratio of .32% is more than five times that of SCHF!
Action item: Are your ETFs “hedged for currency risk?” We prefer non-hedged ETFs, as currency movements are virtually impossible to predict over the short-term. In addition, historical evidence would suggest that exposures to multiple currencies have diversification benefits. Hedging currency risk can be expensive. Think of it as paying an insurance premium to defend against a weaker foreign currency.
Next week, we run through a similar exercise for Emerging Markets.
Disclosure: All charts were created/sourced by YCharts.
