I know a financial advisor who loves to talk about the Santa Claus rally every December. He has an outstanding mustache year-round (not just in November) so we shall came him Mr. M.
As I awaited Mr. M’s arrival for our coffee date, I wondered to myself how long it would take for him to bring up a variation of the Santa Claus rally. The only rule for myself was I couldn’t lead him into the topic. A question like “Mr. M, do you see any catalyst for the month of December?” would be an obvious set-up. I set the over/under at 5 minutes.
If this was a Las Vegas sportsbook, the “sharp money” would have pounded the under. They would have been right. Less than three minutes into our conversation, Mr. M starts getting worked up about the Santa Claus rally. “Consumers are going to spend a ton of money, malls are crowded, online shopping is set for the biggest year yet,” on and on Mr. M went.
I appreciated Mr. M’s enthusiasm, but wanted to dig a bit deeper. Is there a seasonal anomaly in the market that increased our chances of a positive return in December? Is the Santa Claus rally legit? Was Mr. M crazy?
We went back and looked at the last 10 years of S&P 500 returns in the month of December. (There are many ways to define the Santa Claus Rally, we chose to look back at the last 10 Decembers).
Here’s what we found…

The above graphic shows the S&P 500 achieved a median return of 1.12% in the month of December for the past 10 years.

With the exception of 2015, the S&P 500 posted positive returns every December for the past 10 years.
Recent history would suggest there is some merit to the Santa Claus Rally thesis. However, let’s compare December to every other month for context. All of the below numbers are median change percentages going back 10 years (2008-2017).
January -0.66%
February 1.45%
March 2.00%
April 0.82%
May 1.26%
June -0.43%
July 2.65%
August -0.09%
September 1.08%
October 2.73%
November 2.40%
December 1.12%
While the month of December is nothing to sneeze at, it’s hardly the best performing month over the past 10 years. In fact, December is in the bottom half of best performing months (7th best)!
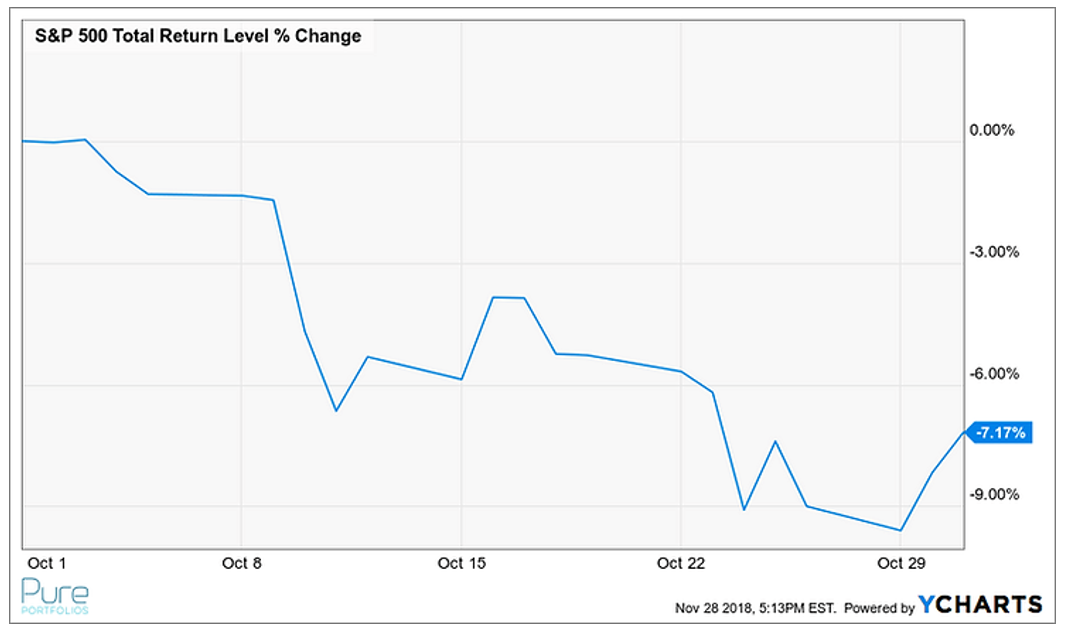
You might wonder why an investor wouldn’t just pile into the best performing months, and sell during the worst performing months. Well, like most “anomalies” in financial markets, they seldom have much predictive value and can make even the savviest investors look downright foolish. Take October 2018 as an example…

The above graph shows the S&P 500’s total return in October 2018. Historically, October is one of the strongest return months, but not the case this year.
There are many theories on why the perceived Santa Claus Rally exists i.e. tax related adjustments, holiday optimism, light volume (people on vacation) etc.
In our opinion, developing hard and fast rules makes humans feel better through the illusion of control. The next time someone mentions the Santa Claus Rally, you now know it’s just another month on the calendar.
