
“Expectation is the root of all heartache.” – William Shakespeare
Under promise, over deliver. The universal mental shortcut for managing expectations.
Set the bar low, exceed expectations, look good. Easy game.
I almost fell out of my chair when perusing a Natixis Global Survey* of investor return expectations.
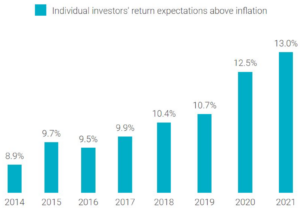
Source: Natixis Investment Managers Global Individual Investor Surveys
The above graph shows steadily increasing investor return expectations year over year. The past decade of outsized returns has emboldened investors to think that the good times will continue.
When the global economy was shuttered in early 2020, investors assumed that would have a lasting negative effect on equity markets. When the market snapped back violently, investors were caught off-guard. With the economy reopening and gaining positive momentum, investors are parlaying the good news into outsized equity market returns.
This conclusion seems too neat and tidy. We are reminded of Bob Farrell’s investing rule #9: when everyone agrees, something else happens.
Even if returns are positive, investor expectations are unhinged from professional investors.
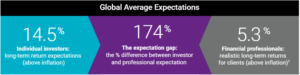
Source: Natixis Investment Managers Global Individual Investor Survey
The above graphic shows global individual investors long-term return expectations of 14.5% per year. Financial professionals have a much more muted view of future returns, projecting 5.3% per year. Both return numbers are on top of inflation. For instance, if inflation runs 3% per year, individual investors are expecting nominal returns of 17.5% per year! This seems like a stretch even for the most optimistic bulls.
Shifting to U.S. investors, the expectation gap is even wider…
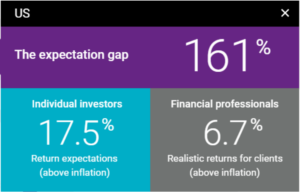
Source: Natixis Investment Managers Global Individual Investor Survey
While the U.S. expectation gap is more narrow, the absolute numbers are higher for both individual and professional investors. Returns between 10-20% are quite common for a single year, but very uncommon over a longer period of time.
How uncommon? According to fourpillarfreedom.com, the best 10-year period for the S&P 500 was 17.9% between 1949-1958 (since 1928).
The median annual returns for 10-year periods since 1928 has been 6.5%.
I don’t think it’s a stretch to say individual investors are off their rocker.
Why are investors so optimistic? We keep coming back to human psychology.
It’s been tough to miss the last decade. It’s created many investing geniuses. It’s been said no one ever learned anything in a bull market.
Investors anchor to what just happened, also known as recency bias. Well, what just happened was a golden decade, especially for U.S. investors. It’s human nature to expect the good times to continue.
Individual investors continue to correlate economic prosperity and equity market returns. As we’ve discussed in prior blogs, the relationship is not linear or even correlated.
And perhaps the most powerful trend, the new age investor (more like speculator) embraces leverage, options, meme companies (AMC & Game Stop), and meme digital assets (Dogecoin). It wouldn’t be a stretch to say the spirit of the YOLO (you only live once) trader has found its way into individual investor expectations.
The final part of the Natixis survey conveyed investment lessons learned during the COVID sell-off…
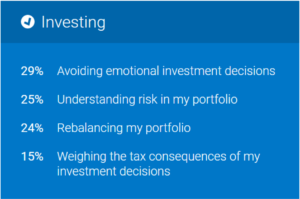
Source: Natixis Investment Managers Global Individual Investor Survey
We harp on identifying your blind spots to avoid emotional investment decisions. We pound the table on understanding risk in your portfolio. The good news is that you can learn from other people’s mistakes by preparing for the next market event today.
In our opinion, this has nothing to do with valuations, interest rates, inflation, or anything else. Markets move in cycles. What’s easy can quickly become difficult. Good periods can be followed by ugly periods.
Temper your expectations. Don’t depend on outsized returns to make your plan favorable. Set your return bar low, everything extra is gravy.
*Natixis Investment Managers surveyed 8,550 investors globally across 24 countries in March and April 2021, with the goal of understanding their views on the markets and investing.
An online quantitative survey of 43 questions was hosted by CoreData Research. Each of the 8,550 individual investors had minimum net investable assets of US $100,000 (or Purchase Price Parity [PPP] equivalent).