“Everything feels unprecedented when you haven’t engaged with history.” – Kelly Hayes, author
The daily flow of negative headlines, market losses, and dire predictions can weigh on even the most experienced investors.
While there’s plenty that could go wrong, it’s not all doom and gloom.
We highlight the good, bad, & ugly of the current economic landscape and financial markets.
The Good
Investor Sentiment
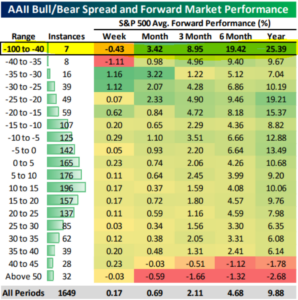
It’s no secret investors are feeling down in the dumps. History has shown when investors feel the worst, future returns are the best.
Destitute investor sentiment is perhaps the most bullish metric we track.
Source: Bespoke Investment Group
The above chart shows AAII’s Bull/Bear Spread and forward S&P 500 performance (1987- April 2022). This rhymes with one of Bob Farrell’s investment rules, “when everyone agrees, something else happens.” When investors agree stocks are headed for the dumps, future returns tend to be overwhelmingly positive.
Normal Correction
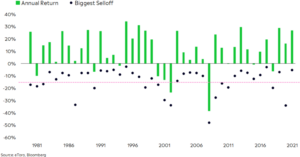
No one likes to lose money, but market sell-offs are normal. The current correction doesn’t stand out from a historical perspective.
Source: eToro, Bloomberg, Callie Cox Twitter
The above chart shows S&P 500 selloffs (black dots) and calendar year returns (green) from 1980-2022. The current selloff is marked with the pink dotted line (as of May 6th, 2022). Virtually every year in the data set is marked by a selloff. The 2022 pink line might be slightly more aggressive, but hardly qualifies as an outlier. Further, it’s not uncommon for annual returns to finish positive after a intra-year selloff.
Technology Washout
In hindsight, the valuations for some technology stocks were absurd. I’m not sure if the tech washout is complete, but many speculative names that were the darlings of yesterday have been absolutely crushed.
In our opinion, flushing out irrational valuations is a healthy function of the market cycle.
Source: Bespoke Investment Group
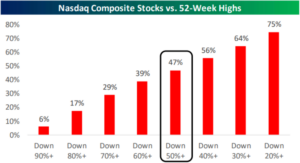
The above graph shows NASDAQ composite stocks vs. 52-week highs. A stunning ~47% of the tech-heavy index is down 50%+ from all-time highs. Seemingly overnight, investors valued real free cash flow over future potential.
Earnings
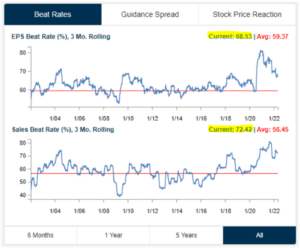
Q2 earnings have held up nicely. On aggregate, U.S. companies are tracking ~70% beat rates for revenue and earnings.
Unfortunately, above average revenue and earnings haven’t saved the market.
Source: Bespoke Investment Group
The above graph shows beat rates for earnings per share (top) and sales (bottom) for Q2 2022 (as of May 6th, 2022). Both metrics are above historical averages for beat rates. In addition, more companies are raising guidance for future revenue and earnings rather than lowering guidance.
Valuations
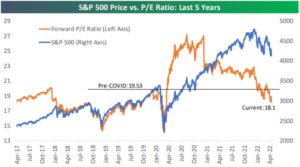
It would be a stretch to say the S&P 500 is cheap, but valuations are more compelling than they’ve been. The recent dip has the S&P trading below pre-COVID levels based on forward price to earnings (P/E).
Source: Bespoke Investment Group
The above graph shows the S&P 500 (blue) and forward P/E (orange) over the past five years. Corporate earnings have held up (the ‘E’ in P/E), but price has fallen (the ‘P’ in P/E).
Poor Performance can Lead to Better Performance
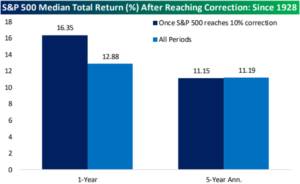
Lower returns today can mean higher returns tomorrow.
Furthermore, markets can swing higher when things seem the worst (see spring 2020). There won’t be any “All-Clear Signal” before markets pivot. In fact, prospects will probably seem dire when the market cycle turns.
Source: Bespoke Investment Group
The above graphic shows S&P 500 median total returns after reaching correction territory (since 1928). The 1-year returns after reaching a correction standout, 16.35% (dark blue) vs. 12.88% (light blue) for all other periods.
The Bad
Lose – Lose Situation
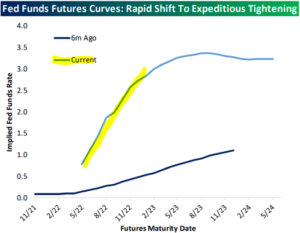
The Fed is playing catch up to adjust rates higher. Go too slow and inflation could get worse. Go too fast and the economy could fall into recession.
Source: Bespoke Investment Group
The above graph shows market expectations for the Fed Funds rate six months ago (dark blue) vs. today (light blue). The current path is much more aggressive than what was priced in six months ago. The quick pivot caught many investors off guard and fueled a turbulent few months for most all asset classes.
Inflation: Something Has to Give
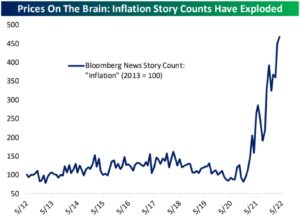
Inflation has been the story of 2022. There’s literally no escaping hot inflation talk…
Source: Bespoke Investment Group
The above graph shows the number of inflation stories published by the media. Inflation is the topic de jour for everyone. The “inflation mindset” can entrench leading to even more inflation. Rising prices have absolutely destroyed consumer and investor sentiment (which could actually help curtain inflation. People tend to spend less when they feel bad).
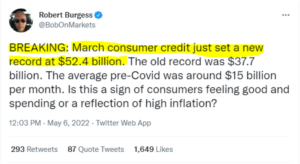
We are on record stating much of the inflationary pressure has been on the demand side. The numbers continue to support this thesis…
Source: @BobonMarkets, Twitter
U.S. consumers continue to spend at a ravenous, record breaking pace. Can they keep fueling demand driven price increases or do consumers pump the brakes? Something has to give!
Market Level Context
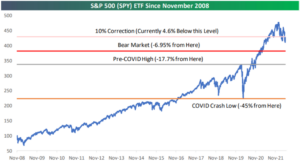
We outlined under “good” that the market sell-off wasn’t an outlier by historical standards. This is also potentially bad as the selloff could get worse.
The S&P 500 still hasn’t technically entered bear market territory (drawdown of -20%).
Source: Bespoke Investment Group
The above graph shows S&P 500 levels since November 2008. As of this writing (5/11/22), we would need to fall ~5% to reach a bear market and ~15% to reach the pre-COVID high. When we zoom out, the current move doesn’t seem look as bad as it feels.
War
Russia invading Ukraine came out of nowhere further disrupting supply chains. The food and energy markets are a mess on the supply side, driving the price of commodities up.
With much of the U.S. heading back to the office, we were greeted with this…

Source: Bespoke Investment Group
The above graph shows the average price of a gallon of gasoline (2012-2022). Everywhere we look, the consumer is getting pinched by increasing prices. When does the U.S. consumer break and change their behavior?
Bonds Not Providing Safety
In most difficult equity markets, bonds often provide investors a non-correlated asset class to mitigate downside risk.
No such luck in 2022.
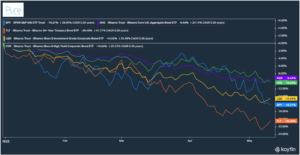
Inflation and a Fed playing catch up has derailed fixed income returns. Diversification doesn’t break down very often, but when it does, it leaves investors with few places to weather the storm.
Source: Koyfin, Pure Portfolios
The above graph shows year-to-date returns for the S&P 500 (blue), Core U.S. Aggregate Bond (purple), long-term U.S. Treasuries (orange), corporate bonds (yellow), and high-yield bonds (green). The silver lining is investors fixed income finally has an “income” component with yields moving higher.
U.S. Housing: Trouble Brewing?
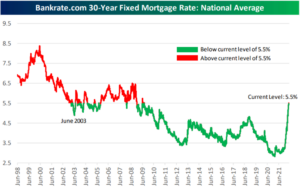
The U.S. housing market has proven resilient, but that could be changing with higher borrowing costs and increasing prices.
In our opinion, the above equation is unsustainable for housing, nor is real estate immune from broader economic stress.
Source: Bespoke Investment Group
The above graph shows the Bankrate.com 30-year fixed mortgage rate. It’s not so much the absolute level of mortgage rates, rather the rapid pace of change. For a new buyer, this could mean thousands of additional interest expense each month.
No one can predict what happens next. Not Wall Street. Not your sister Bertha. Not your neighbor Gertrude.
The events of the last two years are a perfect example.
- In the winter of 2019, no one was predicting a global pandemic.
- In the winter of 2021, no one was predicting Russia invading Ukraine.
- What derails markets is seldom what people are talking about.
Stay humble, stay flexible, and be able to change your mind.
To find out how Pure Portfolios is managing risk in this environment, please click here or email insight@pureportfolios.com.
