“The market is being driven by the performance of only 7 stocks!” – Everyone
Yes, it’s true.
The S&P 500’s 2023 performance is being propelled by a handful of stocks.
The month of May was a poster child for the mega-cap rally. According to Bespoke Investment Group, the 10 largest stocks in the S&P 500 rallied an average of 9.11%. The 490 smallest stocks in the index fell an average of 4.11%.
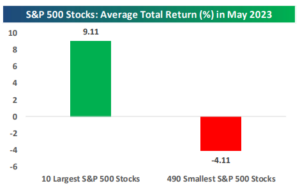
Source: Bespoke Investment Group
As we mentioned in our May 2023 video commentary, mega-cap top heaviness is less than ideal, but it doesn’t automatically spell doom either.
Let’s set the table.
The S&P 500 is a market cap weighted index. This means the largest companies (think Apple, Microsoft, Google, etc.) “explain” more of the indexes performance than smaller companies.
Higher market breadth means more stocks are going up than down. Lower market breadth means more stocks are going down than up. In general, investors like to see higher market breadth because it means a greater number of companies are experiencing gains (rather than gains concentrated in a handful of large companies). Market bears are quick to point out today’s low market breadth is an unhealthy sign.
We aim to unpack a) what top-heavy, performance concentration has meant for the S&P 500 going forward and b) future returns for the mega-cap companies driving performance.
The below graphic does a great job of capturing mega-cap companies impact on the S&P 500 year-to-date (data as of 5/24/23)…
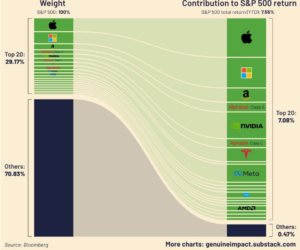
Source: Bloomberg, Visual Capitalist
The above graphic shows the S&P 500 weighting breakdown by company size (left). The largest 20 companies represent almost 30% of the value of S&P 500. The column on the right shows the outsized impact of the largest 20 companies on S&P 500 returns. Mega-cap stocks represent ~30% of the index, but are responsible for ~100% of 2023 S&P 500 performance!
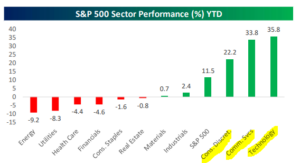
The divergence is captured nicely at the sector level…
Source: Bespoke Investment Group
The above graph shows year-to-date (YTD) S&P 500 sector performance (as of 6/2/23). Mega-cap stocks belong to Consumer Discretionary, Communication Services, and Technology sectors. Every other sector is marginally higher (Materials, Industrials) or down YTD.
If the market is being driven by a handful of stocks, is it a matter of time before the façade comes crumbling down?
Surprisingly…not so much. Of course, this time could be different…
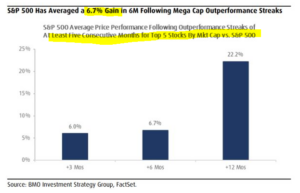
Source: BMO Investment Strategy, FactSet, Michael Batnick blog
The above graph tracks future S&P 500 returns following five consecutive months of large company outperformance (five largest companies by market cap). The S&P 500 averaged a 6.7% gain in six months following mega-cap outperformance streaks. One year later, the S&P 500 was up ~22% following such streaks!
What about the future performance for the mega-cap leaders?
Not so rosy…
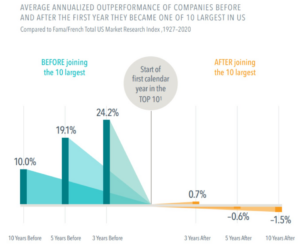
Source: Dimensional Fund, Servo Wealth, Meb Faber
The above graphic shows annualized performance for companies before becoming a top 10 behemoth (blue) and after reaching the top of the corporate mountaintop (orange). This should be a cautionary tale for those looking to performance chase into today’s winners.
In summary…
- Mega-cap outperformance (low market breadth) historically hasn’t led to poor future returns for the S&P 500 (there’s no promise this continues).
- Performance for the largest 10 companies after they reach mega-cap status has been historically poor the following 3, 5, and 10-year periods.
- Investors would do well to be wary of position sizing, stock concentrations, and performance chasing into today’s winners.
What do you think of the S&P 500 being driven by a handful of stocks?
Shoot us a comment insight@pureportfolios.com
