
“History never repeats itself, but it does often rhyme.” – Mark Twain
There have been 85 cycles where the Fed has increased interest rates since 1960.
What typically happens before the Fed signals a pivot?
In this instance, we define pivot as going from increasing rates to cutting rates. The path would likely go: raise less, pause, cut.
We look for clues on inflation, 10-year U.S. Treasury yields, stock market bottoms, and previous cycles.
Inflation
Alf @macroAlf (Twitter), author of The Macro Compass noted that inflation only needs to moderate for the Fed to stop hiking.
“Central Banks on average stop hiking as soon as inflation has decelerated a meager 10% from its peak.”
If inflation was running 8.2% year-over-year, a 10% decrease would mean that if inflation normalized to 7.38%, the Fed could potentially pause rate increases (8.2*(1-.10) = 7.38%).
This is a much lower hurdle than the consensus. Market participants seem to believe inflation needs to return to the Fed’s 2% target to see a pivot.
If historical Fed action holds, we could be much closer to a pivot than expected.
10-Year U.S. Treasury
In my experience, the U.S. Treasury market is the smartest “person” in the room.
The below graph shows the 10-Year U.S. Treasury yield before and after the last six Fed pivots (going from rate hikes to rate cuts).
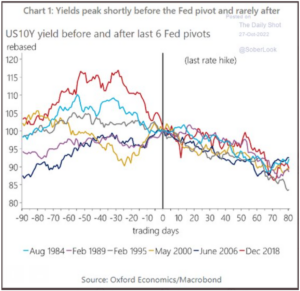
Source: Oxford Economics/Macrobond
The above graph shows the 10-Year U.S. Treasury yield during the last six Fed pivots. There’s a distinct pattern of the 10-Year yield peaking shortly before the Fed changes policy direction. Post pivot, the 10-Year yield drifted down in all six instances.
It’s impossible to predict what happens next, but here’s where the 10-Year U.S. Treasury yield sits today (as of 11/1/22)…
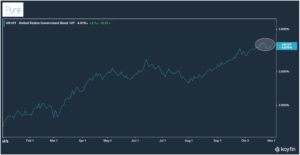
Source: Koyfin, Pure Portfolios
The above graph shows the 10-Year U.S. Treasury yield (as of 11/1/22). Has the 10-Year yield peaked, signaling a potential Fed pivot?
Fed Pivots and Market Bottoms
What does a potential Fed pivot mean for stock prices?
Since 1973, the bottom was in once the Fed decided to halt rate increases and implement the first rate cut.
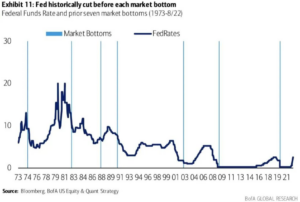
Source: Bloomberg, BofA US Equity & Quant Strategy
The above chart shows market bottoms (light blue lines) & Fed funds rate (dark blue line). There’s a clear relationship between Fed funds going down (cutting) and market bottoms.
Timing of Last Hike and First Cut
Let’s say the Fed pauses rate increases. How long before the first rate cut?
Since 1971, the average time lag between last cut and first hike is ~ six months.
The potential path might be hike, pause for six months, rate cut.
Using history as a guide, that could mean we see our first rate cut summer of 2023.
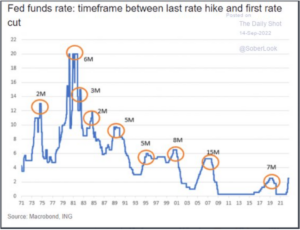
Source: Macrobond, ING
The above graph shows the Fed funds rate (blue) and the lag between last hike and first cut (orange circles).
A natural ebbing of inflation unlocks the possibility for the Fed to pivot.
Historically, inflation doesn’t need to return to the Fed’s 2% target to trigger a monetary policy change. A modest decrease in inflation could lead to a Fed pivot & market inflection point.
If market history holds, the hurdle for a Fed pivot is lower than most realize.