“Whoever controls the volume of money in any country is absolute master of all industry and commerce.” – James A. Garfield, 20th President of the United States
It would seem the Fed is finally on the verge of cutting rates. The Fed futures market is predicting a September cut is a virtual certainty.

Source: CME Group
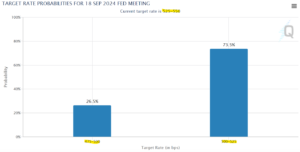
The above chart shows the probability of a rate cut for the September Fed meeting. As of 8/20/24, markets believe there is a 73.5% likelihood the Fed cuts by 0.25%. The odds of a 0.50% cut are 26.5%. In our opinion, the Fed could spook the market if they cut by 0.50%. We would expect a 0.25% decrease in the Fed funds rate.
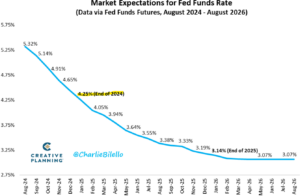
We can also reference the Fed futures market for rate expectations over next 24 months (these are almost certainly to be incorrect, especially the further we go out)…

Source: Creative Planning, CME Group
The above chart shows market expectations for interest rates through August 2026. The Fed futures market is pricing in 3-4 rate cuts prior to year-end. Keep in mind, these are simply market participants’ best guess. Market expectations called for six rate cuts coming into 2024 and we have yet to have one. A hot inflation report could throw a wrench into the Fed’s plans.
The Fed is in an unenviable position. Cut rates too quickly which could trigger a second wave of inflation. Keep rates high for too long and potentially push a weakening economy into a recession.
The ideal outcome would be stomping out inflation while keeping the economy humming along.
Why is September the appropriate time to cut rates?
Inflation has steadily decreased towards the Fed’s 2% target.
The economy is showing cracks.
Rate markets are signaling Fed policy is too restrictive.

Source: Bespoke Investment Group
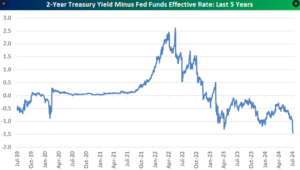
The above chart shows the 2-year Treasury Yield minus the Fed funds rate. When the blue line is above zero, Fed policy is accommodative. When the blue line is below zero, Fed policy is restrictive. At current levels, Fed policy is the most restrictive at any point over the past five years. The market is essentially telling the Fed interest rates are too high.
How does a rate cutting cycle impact future stock returns?

Source: Creative Planning
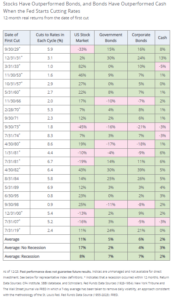
The above data shows S&P 500 performance after the Fed’s first rate cut (1995 – 2024). The return data is all over the place. It would seem a slow, gradual reduction of rates is preferred. A sizable cut (or a large drop in bond yields) could signal economic stress. Notice the 0.50% cuts in 2001 & 2007 preempted major market events (tech bubble and financial crisis).
Let’s go back a bit further to see stock price changes during rate cutting cycles…

Source: Hartford Funds
The above chart shows U.S. stock returns during every Fed cutting cycle since 1929. The market was positive one year later in 16 out of 22 instances when the Fed first cut rates; posting an average gain of 11%. It’s not a surprise stock returns fared better if a recession was avoided but, even if it wasn’t, returns were still positive on average.
Takeaways…
- It looks like the Fed will cut interest rates in September 2024
- 25% cut is most likely, but 0.50% reduction is on the table
- The Fed could cut 3-4 times prior to year-end due to slowing inflation, softening economy, and overly restrictive policy
- Stocks tend to do well during Fed cutting cycles averaging an 11% return one year after the first rate cut (data includes 22 rate cutting cycles since 19
- Large Fed cuts (0.50%) or more could equate to economic & investor pain. It would seem a slow, measured reduction of rates is preferred
