They’ve done studies, you know. 60% of the time, it works every time.”– Brian Fantana, Anchorman: The Legend of Ron Burgundy.
Profit seeking investors are always looking for market anomalies to exploit. Some are ridiculous, like the Super Bowl indicator which states if a team from the AFC wins, the market will decline (an NFC victory would mean a positive market). Other anomalies, like “Sell in May and Go Away” have merit, but if misused could result in disaster.
We look to separate fact from fiction by evaluating past market data and offering practical tweaks you can make if you feel compelled to do something.
The actual idea of “Sell in May and Go Away” originated from London elite looking to leave the city during hot summer months*. Eventually, American equity traders adopted the phrase as an investing adage. The saying evolved into a strategy of owning stocks only from November to April, then selling during the more volatile summer months (May to November).
To our surprise, the Sell in May anomaly does appear to hold up through time.

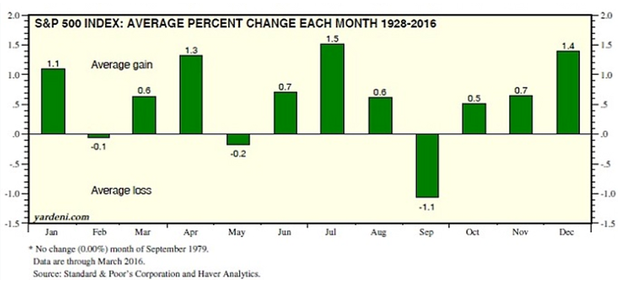
The above graph shows the average monthly gain or loss for the S&P 500 (1928-2016). You can see May and September have the biggest average loss over ~90 years of market data.

Source: S&P Corp. and Haver Analytics
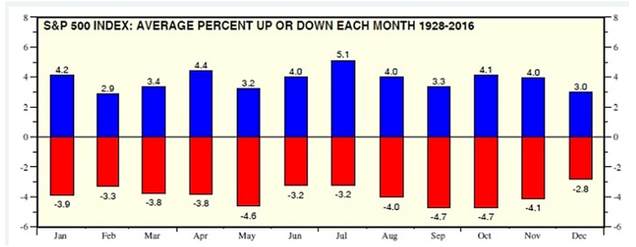
The red shows the average percent up or down each month for the S&P 500 (1928-2016). Again, we observe May, September, and October show the deepest losses.
You might ask, if Sell in May has been proven to work over the past 80+ years, why wouldn’t I own stocks from November to April and hold cash from May to November?
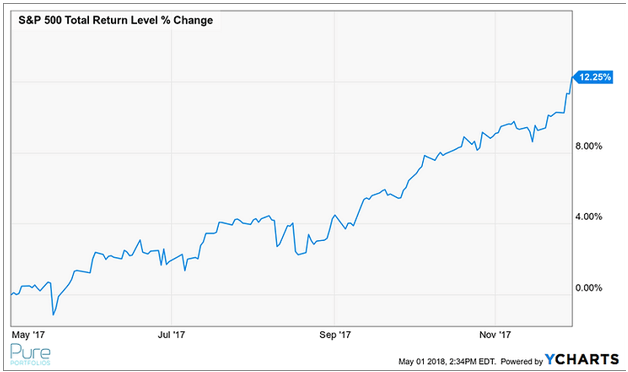
The short answer is because no strategy works all the time and periods of underperformance can cause investors to lose their minds. For example, can you imagine holding 100% cash during the summer/fall of 2017?

One would have a major case of FOMO (fear of missing out) holding cash while the market screamed higher.
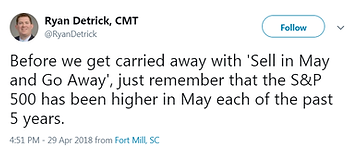
To take this a step further, our Twitter friend Ryan Demtrick from LPL Financial reminds us:

How does Sell in May hold up vs. buy and hold investing over a longer period?

The above graph shows the S&P 500 using Sell in May (red) vs. Buy and Hold (green). You can see the red line doesn’t experience the dramatic swings as a passive buy and hold investor. In the end, Buy & Hold begins to seperate after 2009.
Generally, Buy & Hold will outperform during up markets since we are 100% invested. Sell in May will outperform in down markets since we hold cash for half of the year. Going forward, we feel the impact of Sell in May might be diminished due to the advancement of algorithm, black box, and quantitative strategies. In our opinion, seasonal vacation cycles will have less of an impact in 2018 vs. the 1950’s.
Finally, many of these “fool-proof” anomaly strategies fail to mention taxes, fees, human emotion, etc. which can turn a great idea into a value destroying disaster. If you feel compelled to do something, it’s perfectly fine to rebalance or re-evaluate your asset allocation rather than jumping in and out of the market.
*Source: Investopedia
