We continue our series featuring data from VR Research on “characteristics of a market top.” The summary is broken down by corporate, valuation, economic, market, and sentiment metrics. These are not hard and fast rules, rather a guidepost to help investors better understand where we’re at in the market cycle.
In the subsequent months, we will tackle each category and determine if the current environment is exhibiting signs of topping out. This week we break down market valuation.

Note: VR Research has a typo in the last sentence. It should read “frequent vendor financing of working capital.”
High Price to Sales Ratio
Definition: A valuation ratio that compares a company’s stock price or index price to its revenues. A low ratio may indicate possible undervaluation, while a ratio that is significantly above the average may suggest overvaluation. Source: Investopedia
Source: www.multpl.com
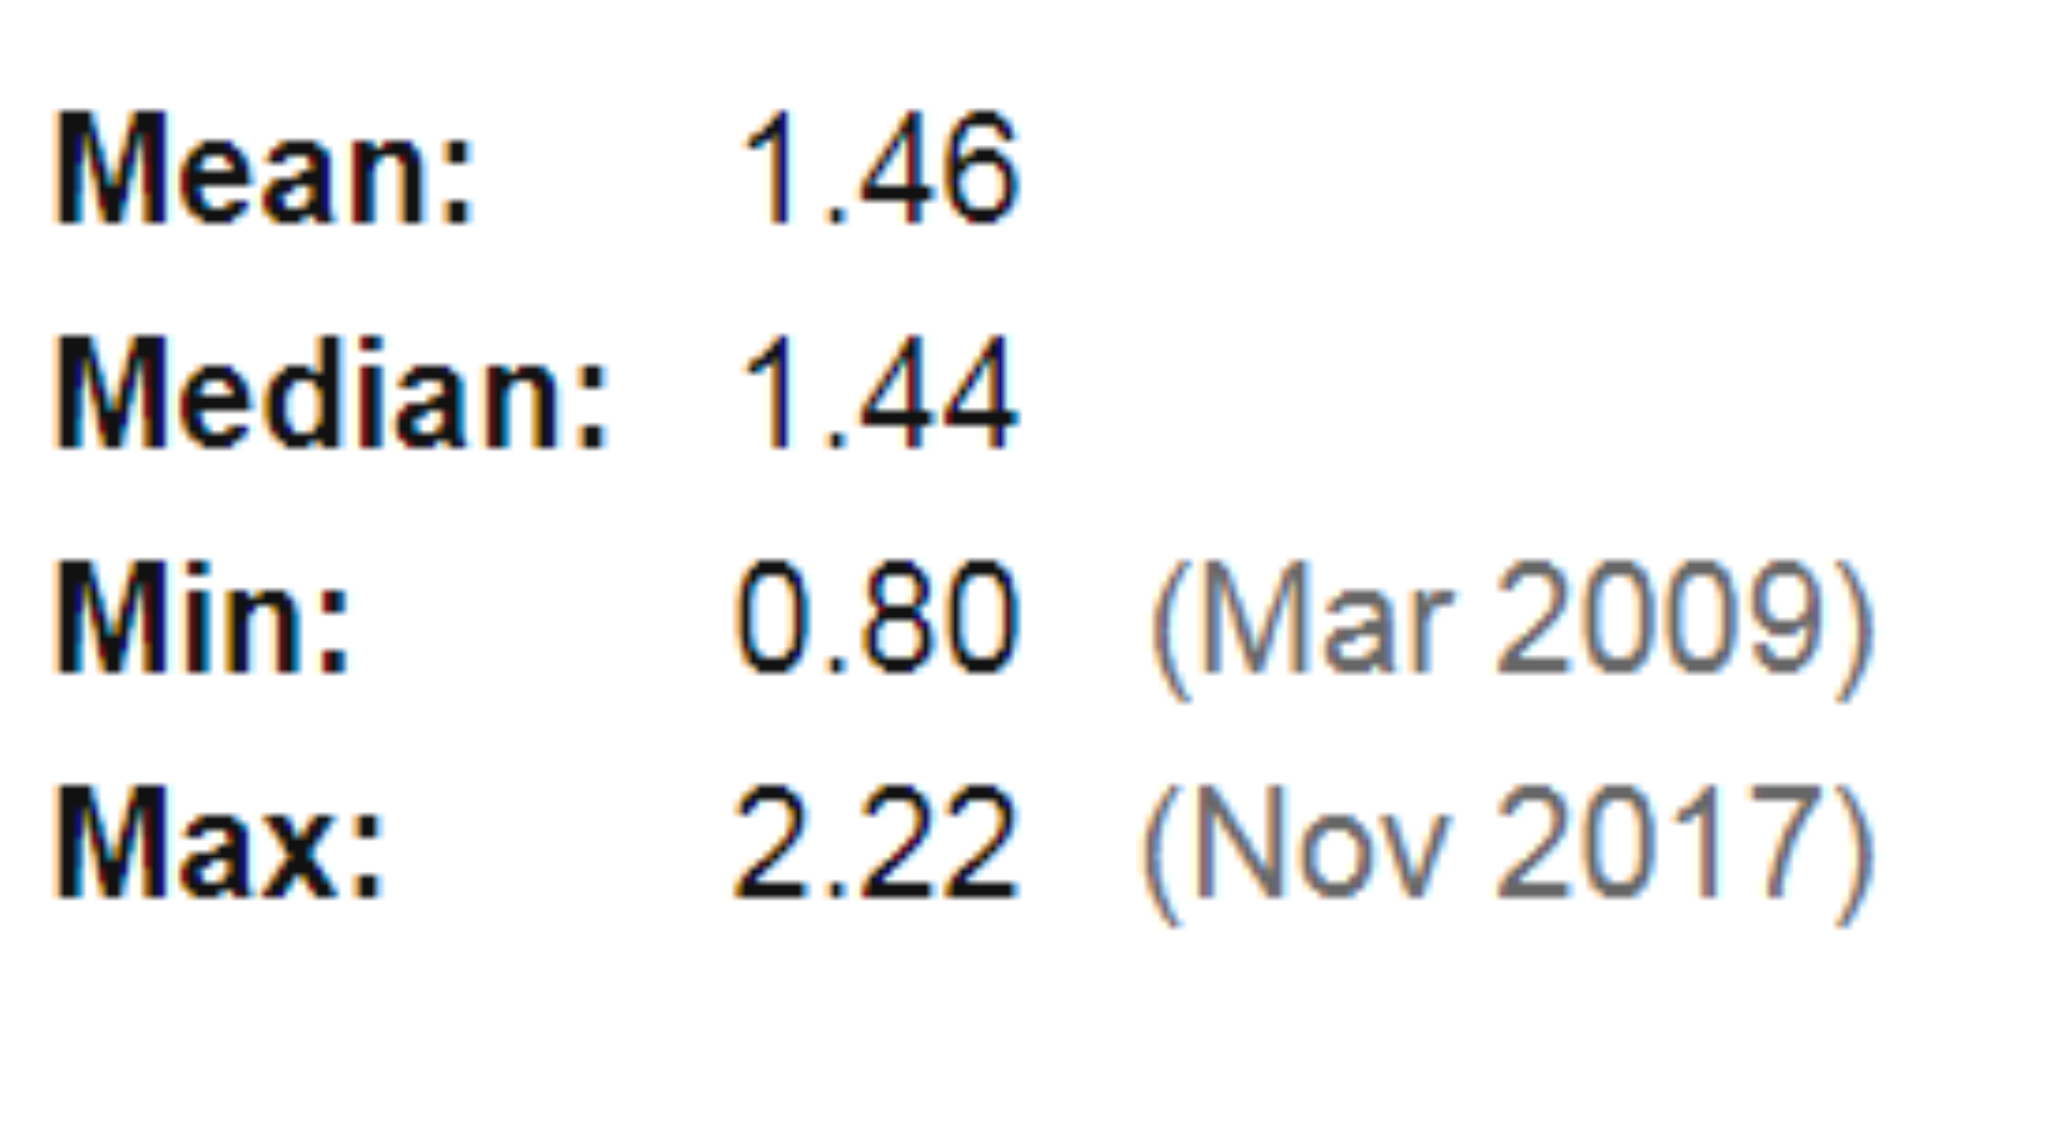
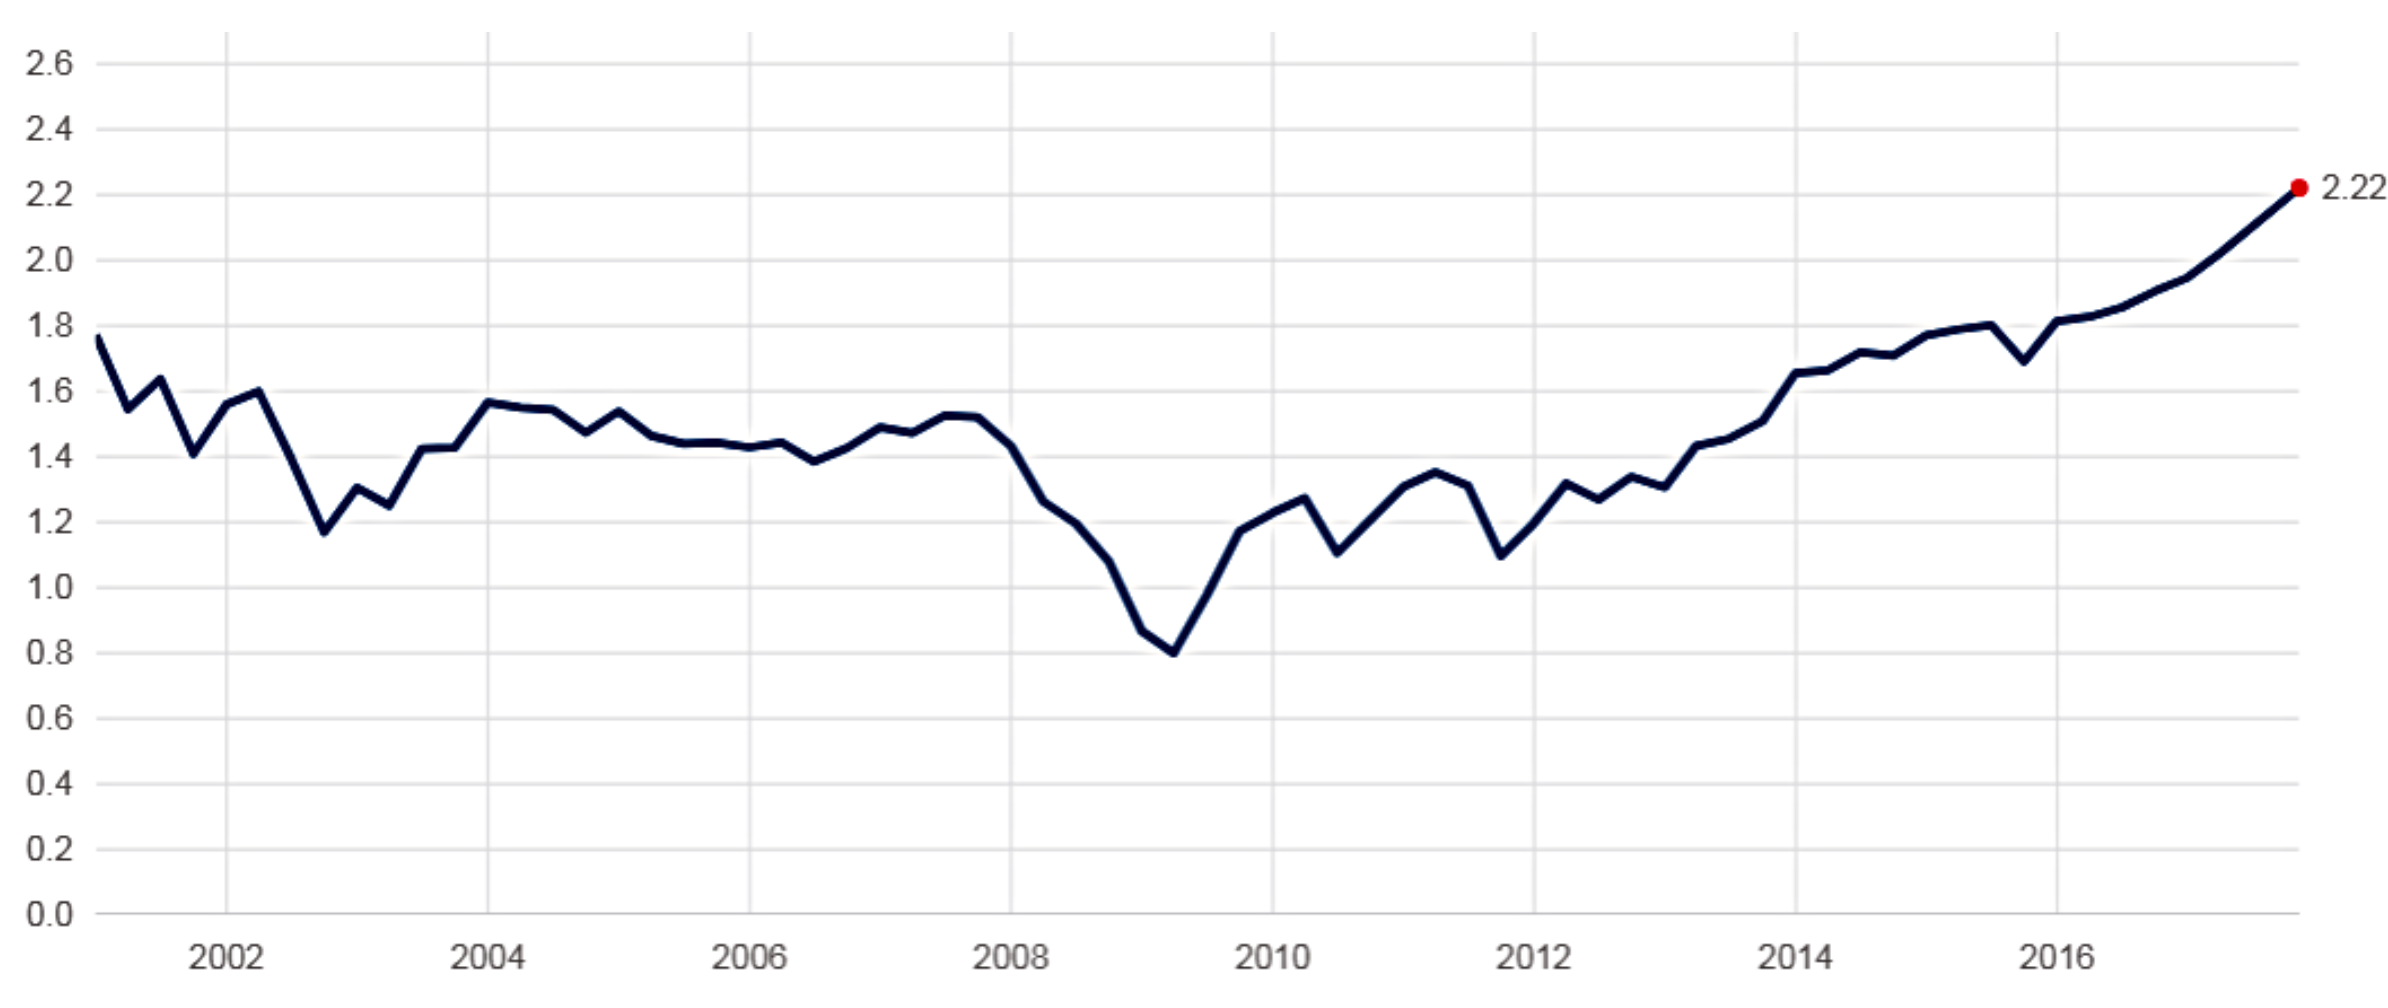
Verdict: Frothy. The S&P 500 Price to Sales (P/S) ratio is at its highest level in 15 years. This means investors are willing to pay more (price) for each unit of sales (revenue). Notice the depressed level of P/S coming out of the financial crisis and the positive returns that followed.
CAPE Shiller P/E High
Definition: The CAPE ratio is a valuation measure that uses real earnings per share (EPS) over a 10-year period to smooth out fluctuations in corporate profits that occur over different periods of a business cycle. The ratio is generally applied to broad equity indices to assess whether the market is undervalued or overvalued. Source: Investopedia
Source: www.multpl.com
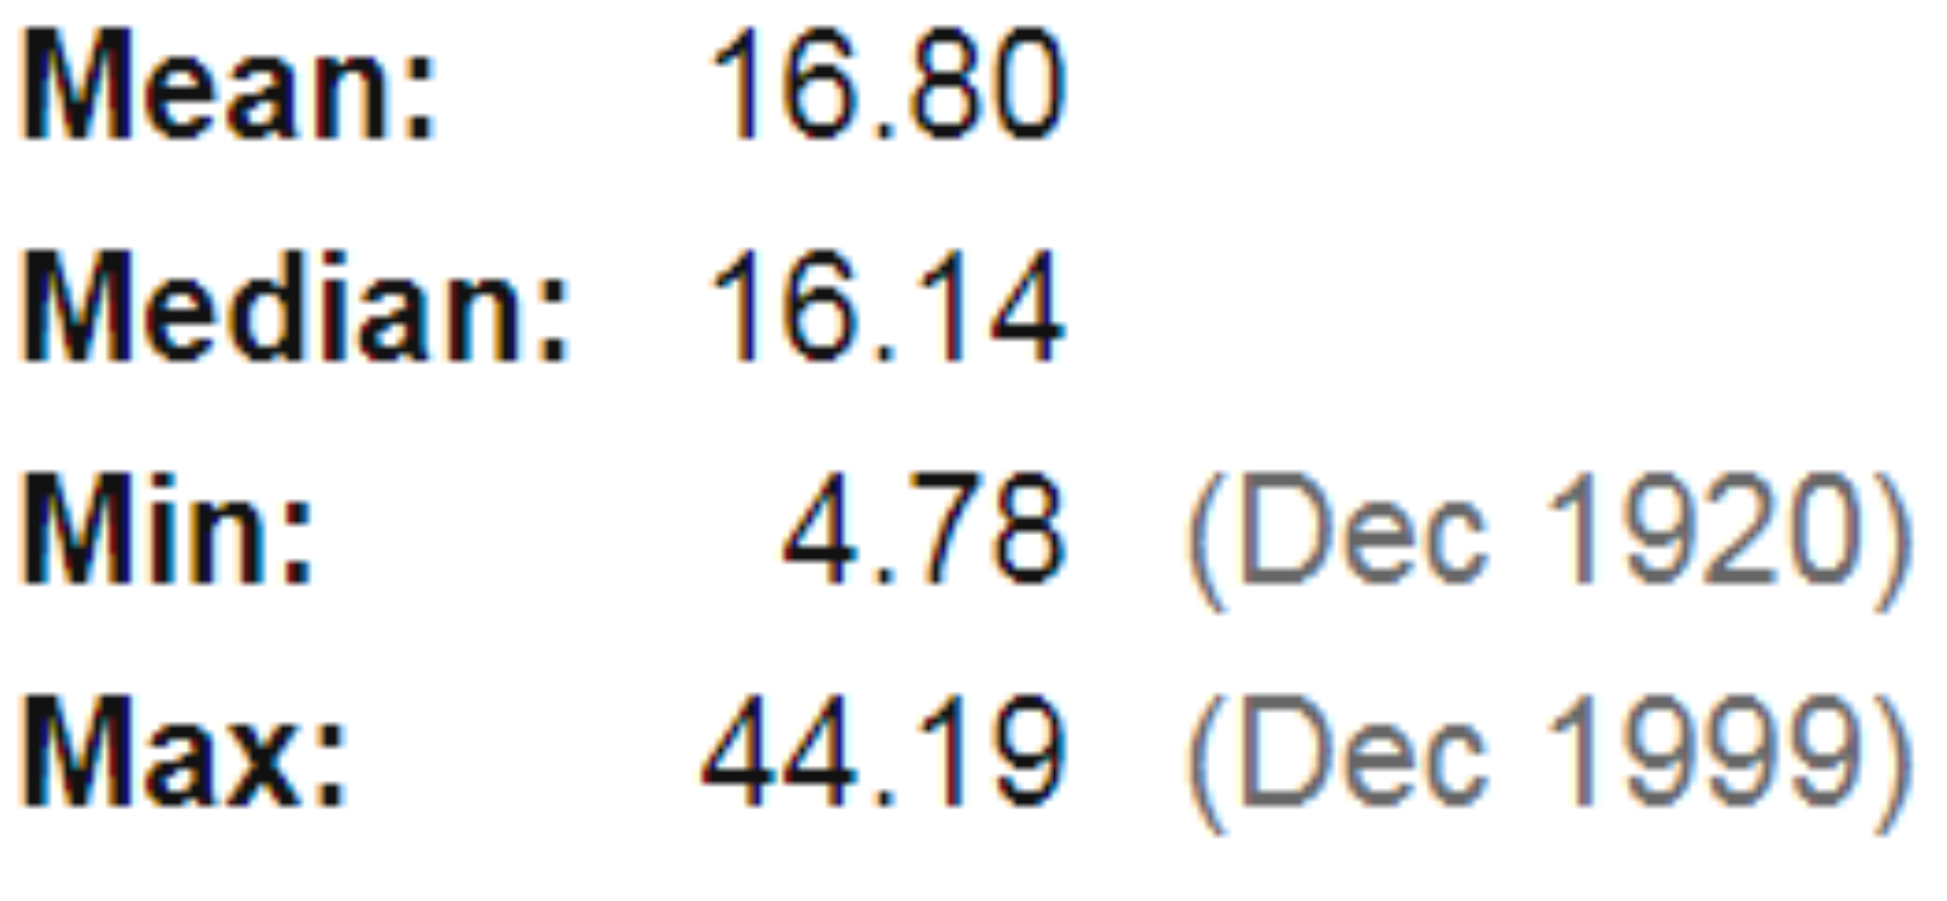
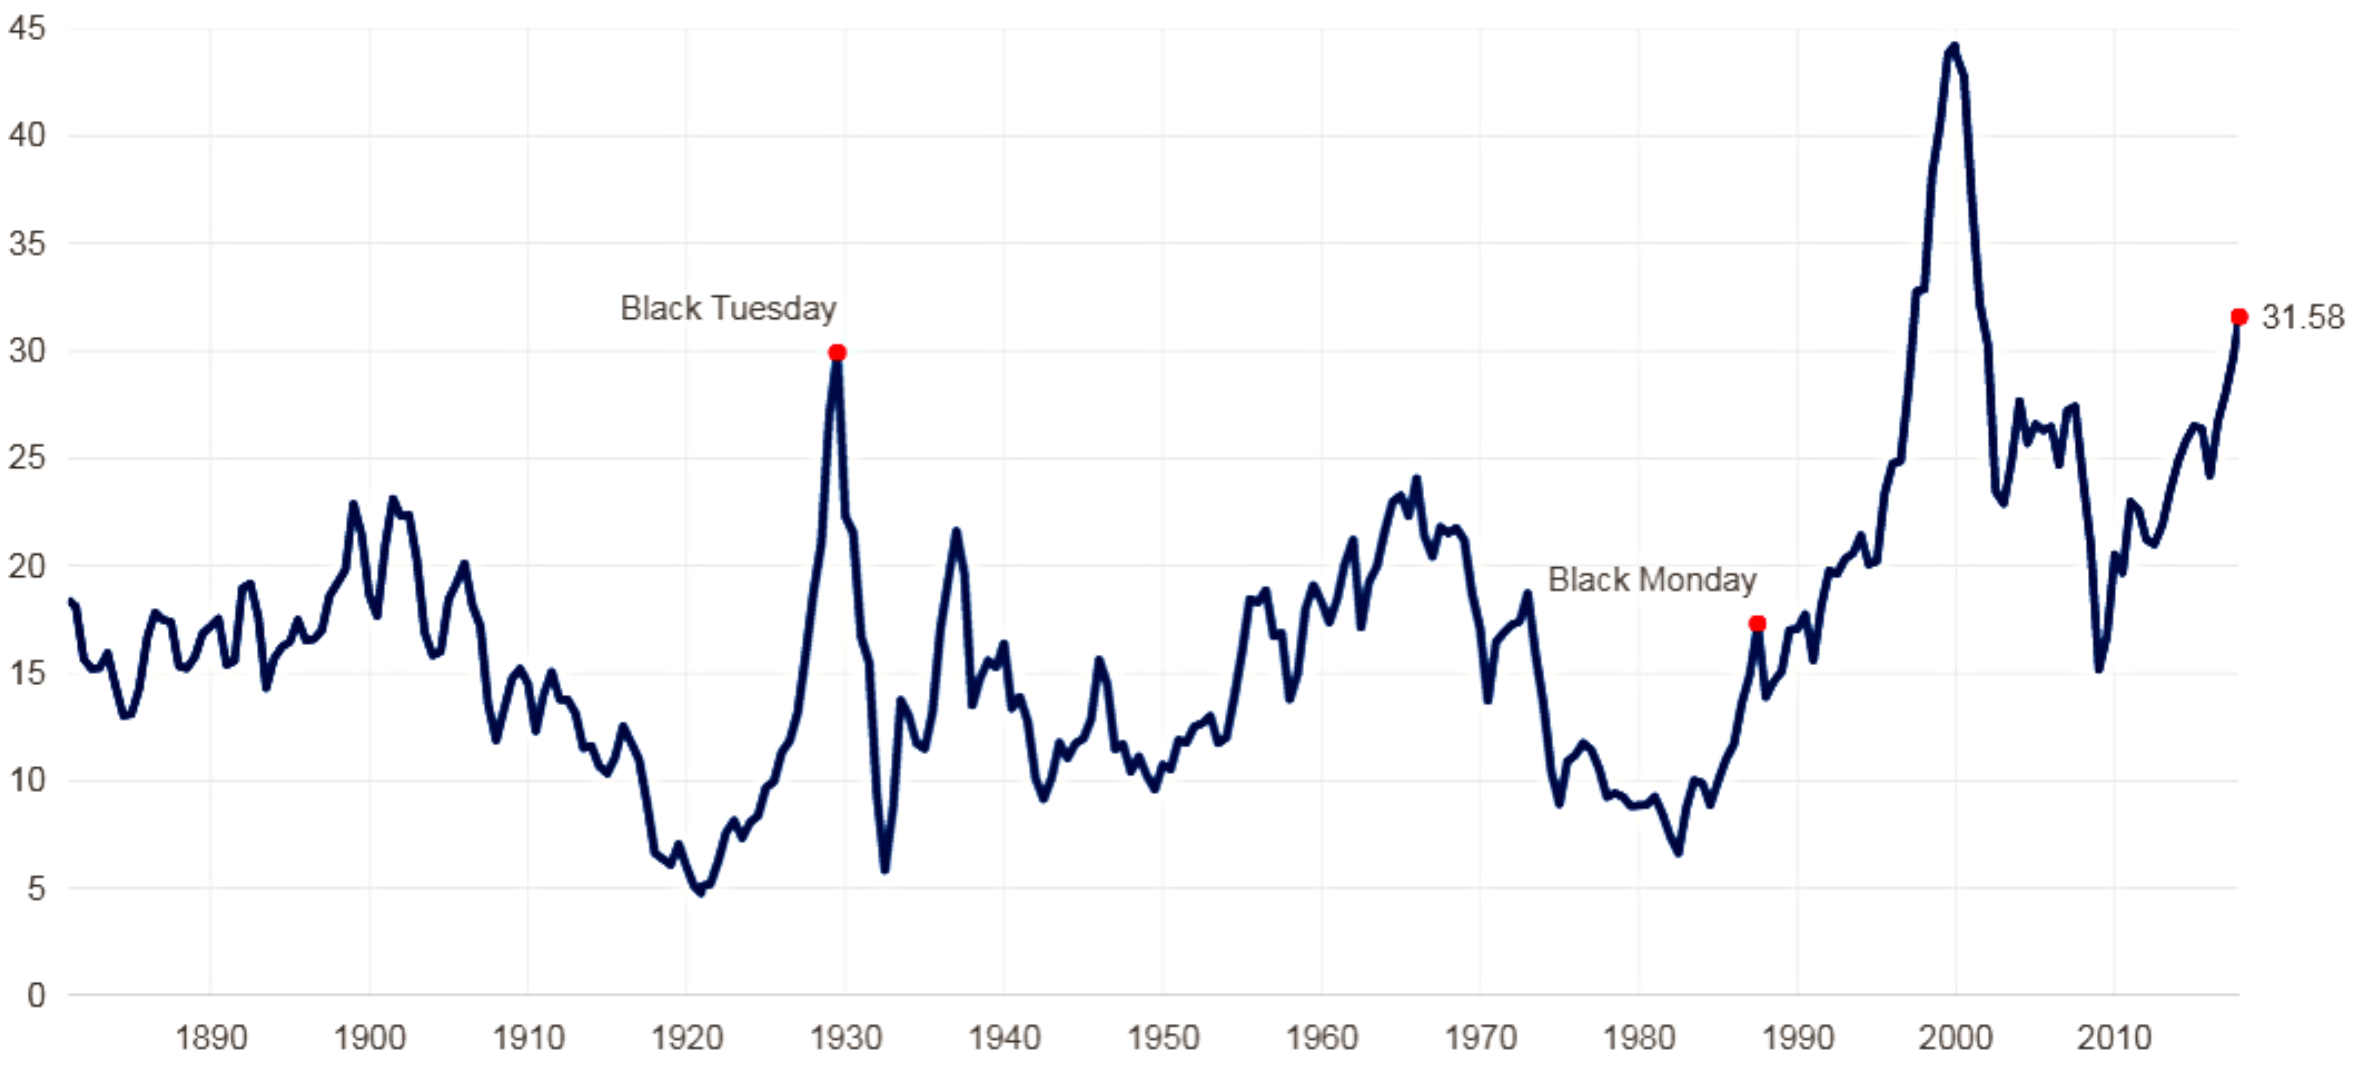
The CAPE or Shiller P/E ratio is frequently quoted as proof the S&P 500 is overvalued. By definition, that would be correct. However, if the average Shiller P/E ratio is 16.80 going back to 1890, we have been in overvalued territory since 2011. There lies the problem with valuation, it offers no indication as to what happens next. What’s technically overvalued can stay that way for extended periods.

Source: Ben Carlson, Bloomberg
Valuation can provide insight on future returns. The above graphic shows CAPE ratio levels (left column) and the following 3, 5, & 10 year returns. We can conclude that lower (higher) valuations lead to higher (lower) future returns.
Verdict: Frothy by historical standards. In our opinion, future returns will be challenged.
Companies Trade at Many Multiples of Book Value (Price to Book)
Definition: The price-to-book ratio (P/B Ratio) is a ratio used to compare a stock’s market value to its equity value. This ratio also gives some idea of whether you’re paying too much for what would be left if the company went bankrupt immediately. Source: Investopedia
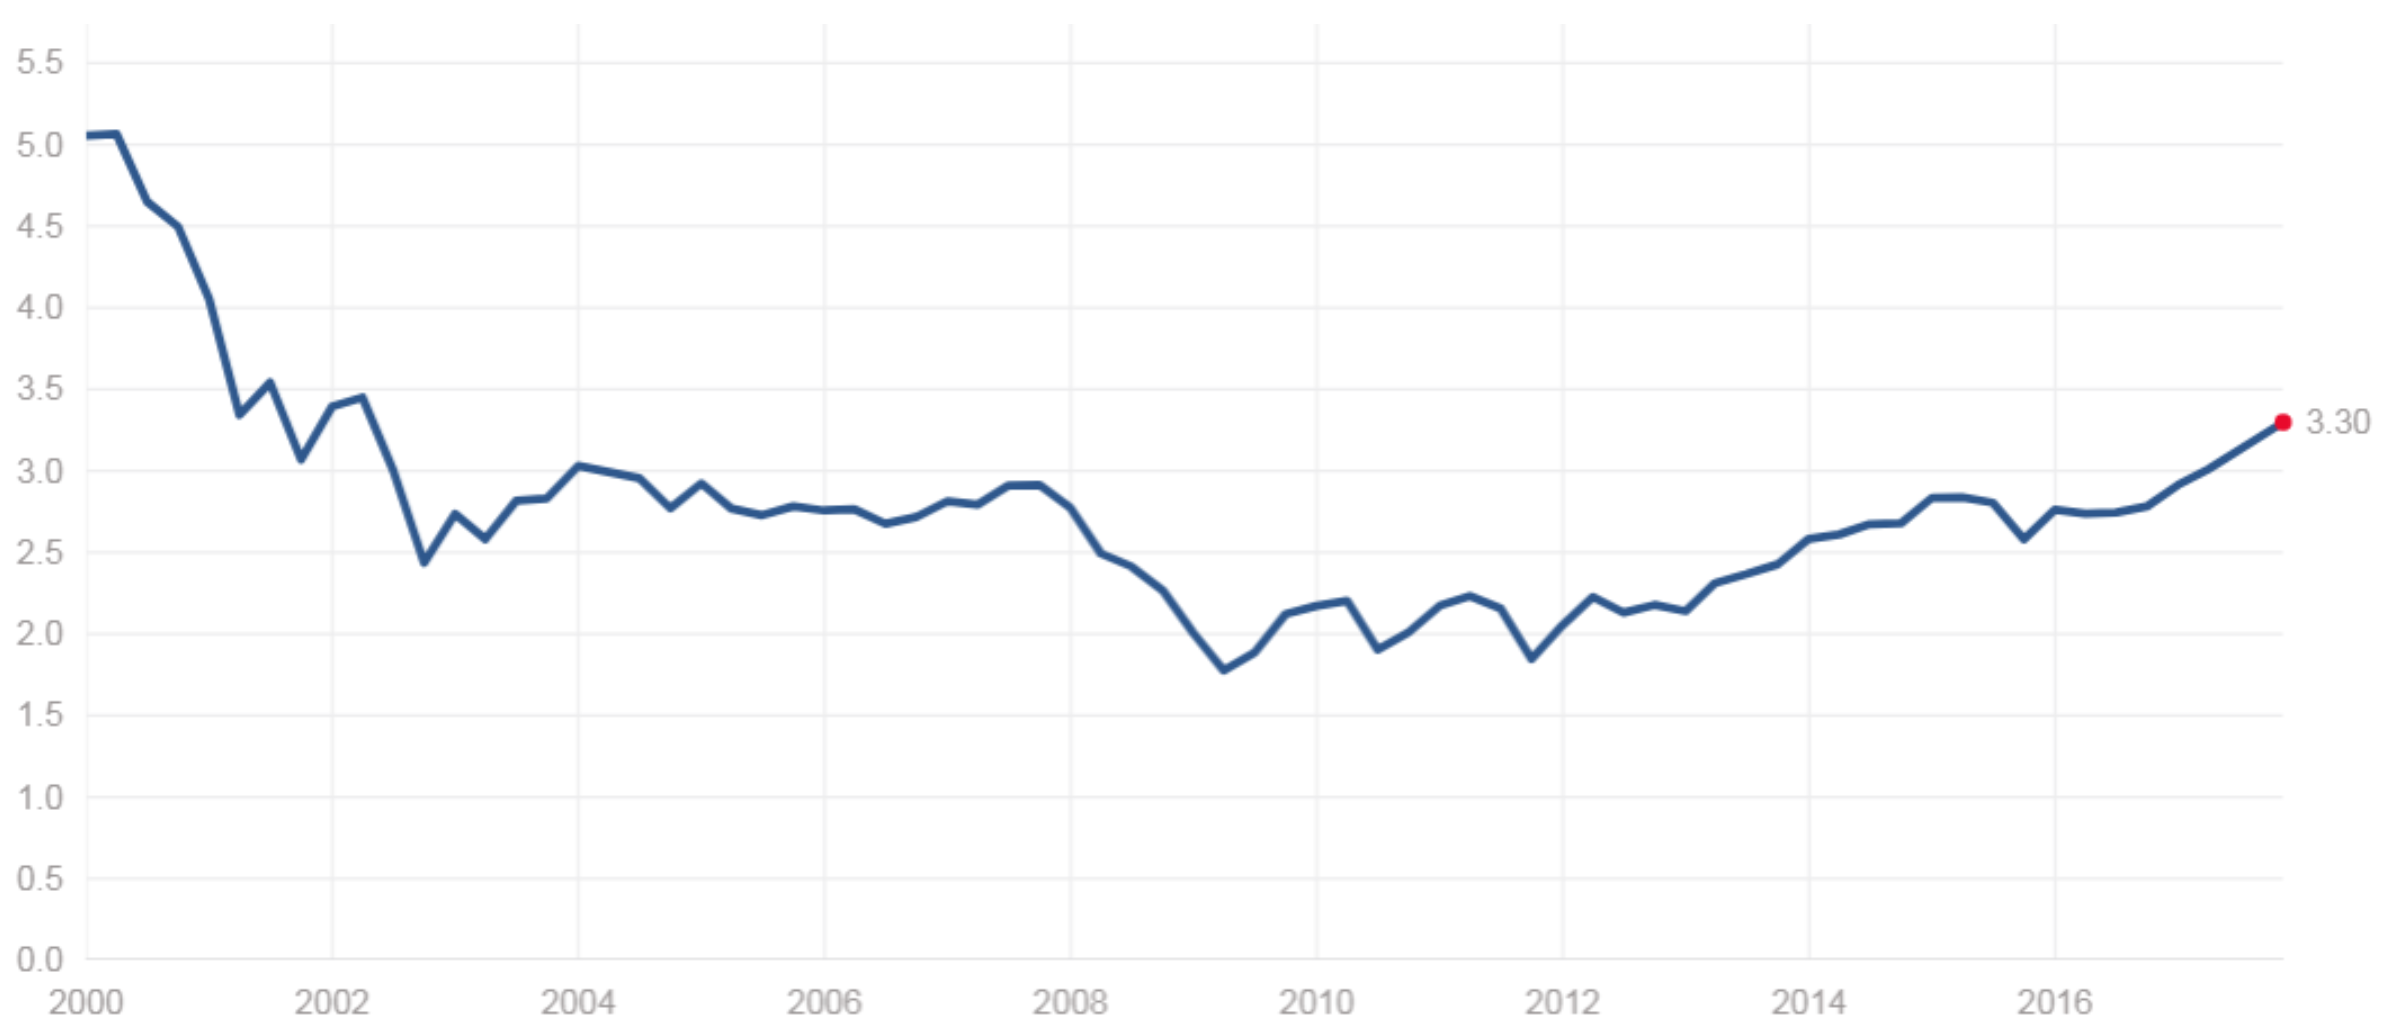
Source: www.multpl.com
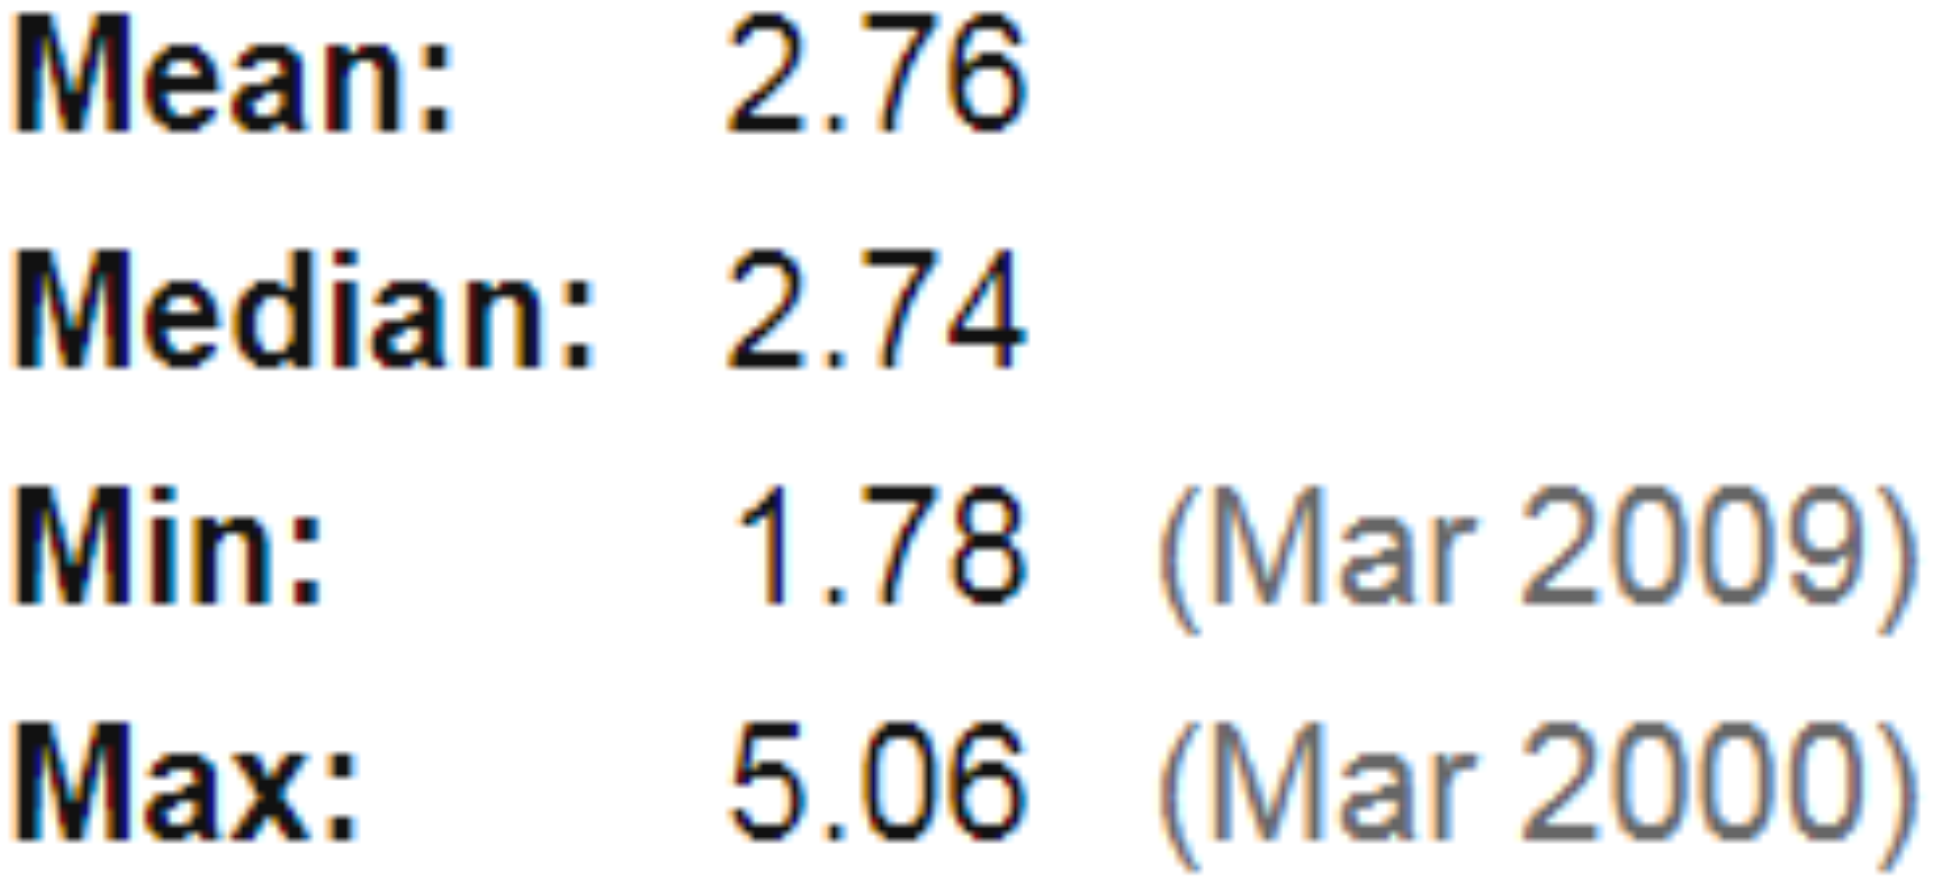
Verdict: Inconclusive. Price to Book (P/B) is a shade above the 17 year average, but well below the tech bubble of 2000.
Frequent Vendor Financing of Working Capital
Definition: Vendor financing is the lending of money by a company to one of its customers so that the customer can buy products from it. By doing this, the company increases its sales even though it is basically buying its own products. Source: Investopedia
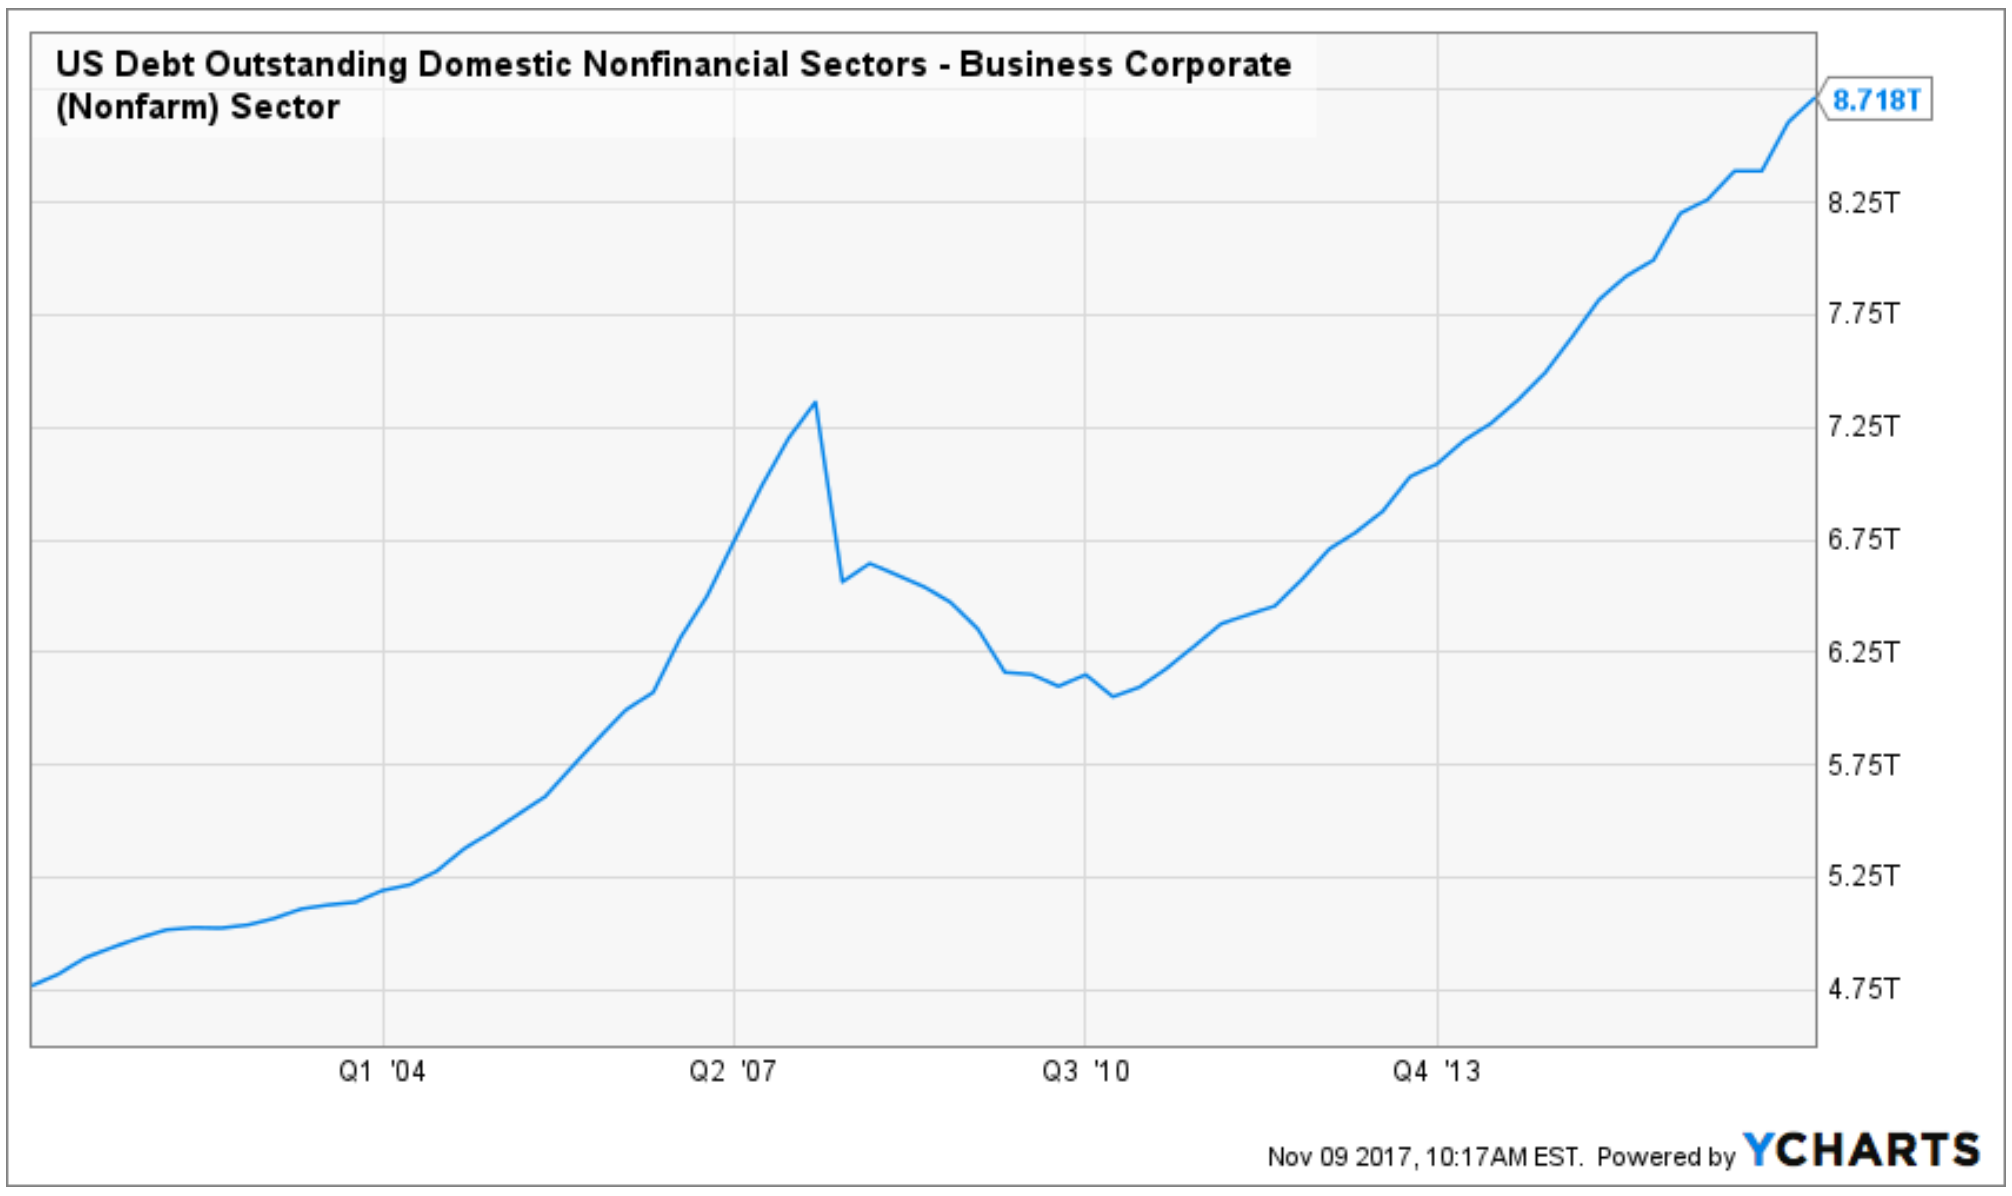
Verdict: Inconclusive. We couldn’t find a reliable data set for vendor financing. However, we can look at corporate debt levels which are at all-time highs. We would be curious to see historical trends for small, private companies.
Virtually every valuation measurement is flashing warning signals. However, valuation offers no insight on what happens next. What is over/undervalued can stay that way for extended periods. Valuation levels can offer clues on the prospects for future returns. Generally, higher (lower) valuations can lead to lower (higher) future returns.
