“Cash shouldn’t be looked at as a burden or drag on your portfolio. It should be viewed as a weapon waiting for an opportunity to pounce.” – Pure Blog, 6/21/2018
If one of the greatest investors of our time was buying stocks hand over fist, would that pique your curiosity?
It turns out Warren Buffett has unleashed a chunk of Berkshire’s cash hoard, $41.5 billion dollars (*net stock purchases in Q1 2022), buying everything from Apple to Occidental Petroleum (he’s also buying back Berkshire shares and acquiring other companies).
Mr. Buffett buying is not a signal the bottom is in. Things could certainly get worse, but inquiring minds might ask, what’s starting to look attractive?
The below list is where we would start sniffing around for value. This is not a recommendation, but rather an exercise for those looking to put cash to work.
Bonds
Fixed income finally has income. The knock on bonds over the last decade were paltry yields. That’s changed with a rise in yields and the Fed’s normalization plan…
Source: Highcharts.com
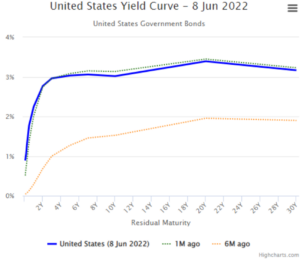
The above chart shows the U.S. yield curve (as of 6/8/22). The royal blue line is the yield curve across various maturities, the green dotted line is one month ago, and the orange dotted line is the yield curve six months ago. In December 2021, an investor would have to invest in a long-term bond (20 or 30 year maturity) to get ~2%. Today, an investor can buy a 2-year U.S. Treasury and clip almost 3%!
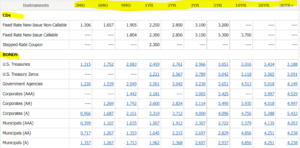
Here’s a look at yield-to-maturity (YTM) across CDs, U.S. Treasuries, U.S. Zero Coupon bonds, Corporate bonds, and Municipals (tax-exempt)…
Source: Schwab
Compared to six months ago, an investor can clip higher income, while taking less interest rate & credit risk. Not a bad proposition for those living off portfolio income, savers, or those looking to park idle cash.
Technology
If 2000 is the poster child for maximum technology sector pain, 2022 is a second cousin.
Source: Pure Portfolios, Koyfin
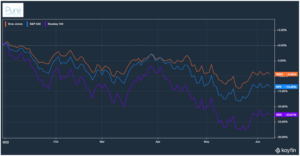
The above graph shows the NASDAQ 100 index (purple) performance year-to-date (as of 6/8/22). The popular tech index was down almost 30% in the first half of the year.
However, it’s much worse for many of the underlying companies in the index…
Source: Bespoke Investment Group
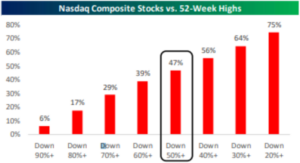
The above graph shows Nasdaq Composite Index stocks vs. their 52-week highs (as of 5/6/2022). An astounding 47% of Nasdaq stocks are down 50%+ from their 52-week highs!
In “risk-off” markets, good companies can get hammered alongside poor companies. An investor with a long-term horizon and an iron stomach could find value at these levels.
China
Chinese stocks have been hit hard by COVID lockdowns, government crackdowns, economic slowdowns, global protectionism, etc.
The fallout for Chinese equities has been pronounced…
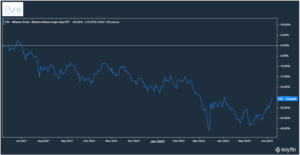
Source: Koyfin, Pure Portfolios
The above graph shows the 12-month performance for iShares China Large Cap ETF (FXI). Chinese large cap stocks have bounced back nicely over the past month, but still trade at a trailing price-to-earnings ratio (P/E) of ~10.
Chinese technology stocks have fared even worse…
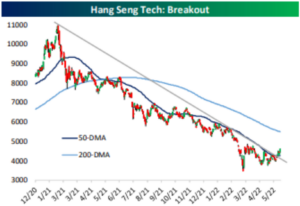
Source: Bespoke Investment Group
The above chart shows the Hang Seng Tech Index (since 12/2020). The index is down ~40% over the past 12 months. There are signs of life as the Chinese government has eased the aggressive regulatory rhetoric.
International Markets
We covered the relative attractiveness of international stocks vs. U.S. stocks in our May 2022 video commentary.
Despite the selloff, U.S. equities are still expensive relative to most global markets.
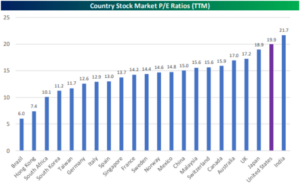
Source: Bespoke Investment Group
The above graph shows the trailing 12-month price-to-earnings ratio of various countries. The higher the number, the more expensive per unit of earnings. You can see the U.S. is trading at the second highest P/E ratio in the world, only behind India.
Despite narratives to the contrary, it’s impossible to time the bottom.
We’ve seen investors sit on cash because they think the market will tank. Market tanks, they think things will get worse, and do nothing. The market rockets higher and they are left in a paralyzing position.
A better strategy is to take a rules-based approach for putting cash to work or getting reinvested.
We’ve crafted a practical approach to allocate cash over time…
Investing Cash in Any Market
Getting a Fat Pitch and Not Swinging
You should note that none of these strategies have anything to do with market timing or what happens next.
In general, if you’re putting cash to work and it makes you uncomfortable, you’re on the right track. In my opinion, the time to get more aggressive is when it feels the worst.
The market dislocations post-pandemic have made cash an asset. This is especially true if an investor has the willingness to deploy when market conditions are perilous.
*Source: Berkshire Q1 2022 Report
