
“The real players in the global economy are consumers and producers (business). Politicians and regulators are similar to referees, which can influence short term ebbs and flows, but ultimately players win or lose games.” – Unknown Twitter User
November 6th, 2018 is fast approaching. 435 U.S. House and 33 Senate seats are up for grabs.
Across the country, thousands of state legislative seats and municipal positions will be filled, and local government will elect new leaders. The majority of U.S. states (36 to be exact) will elect governors this year.
In our politically polarized environment, the stakes seem bigger than ever. Financial journalists are sounding the alarm about what happens next:
Forbes: The Election Could Introduce Another Risk to Stocks (Oct. 9th, 2018)
MarketWatch: Investors May Be Underestimating the Risk Stocks Face From Midterm Elections (Aug. 20th, 2018)
CNBC: With Trade Wars Brewing and the Midterm Election Ahead, Get Ready for a Wild Second Half for Stocks (June 28, 2018)
We have previously written about the perils of weaving investing and politics, “The Danger of Mixing Politics and Investing“. In our opinion, 2017 will be a case study in finance textbooks on why mixing politics and financial markets can lead to misleading conclusions. Seemingly every corner of the globe saw political upheaval while their stocks markets soared.
Of course, political dysfunction isn’t new in this country. However, it’s hard to envision compromise, progress, and unity when we’re engulfed with toxicity.
Remember 1964? We don’t either. Here’s a refresher:
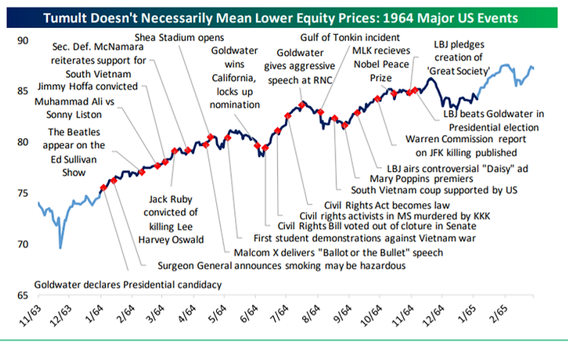
Source: Bespoke Investment Group
Despite extreme social unrest, a radical outsider running for President, war, riots in the street, etc. U.S. equity markets grinded higher.
How have midterm elections affected stock returns historically?
Surprising well.
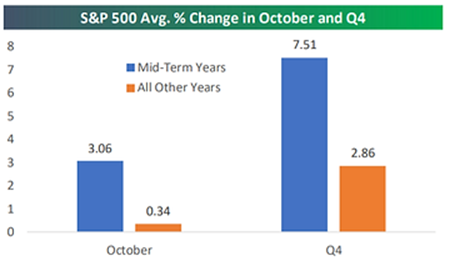
Source: Bespoke Investment Group
The above graph shows the S&P 500 average percentage change in the month of October and the 4th quarter in midterm years (blue) and regular, non-midterm years (orange). It turns out U.S. stocks have crushed it in midterm election years (at least historically).
Here’s a year to year breakdown for the month of October (pre-midterms) and the 4th quarter (post-midterms). Negative (red) years are the exception, not the norm:
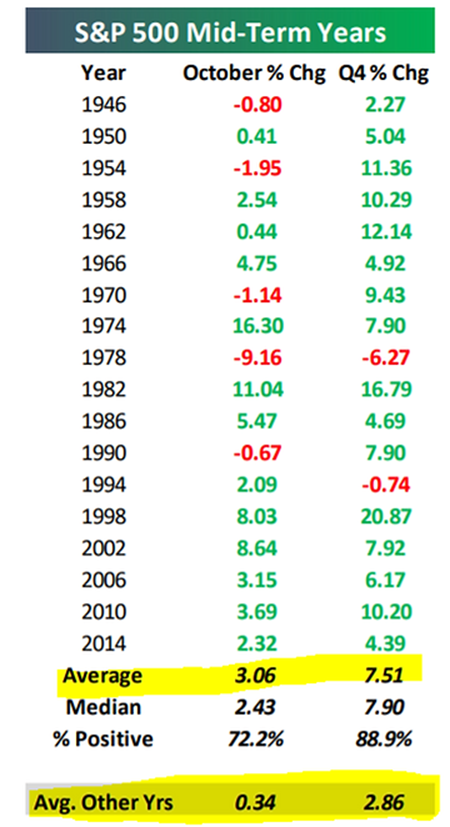
Source: Bespoke Investment Group
The above chart shows S&P 500 returns during midterm election years. Aside from 1978, the returns have been overwhelmingly positive.
The news gets even better for the 12-month period after midterm elections:
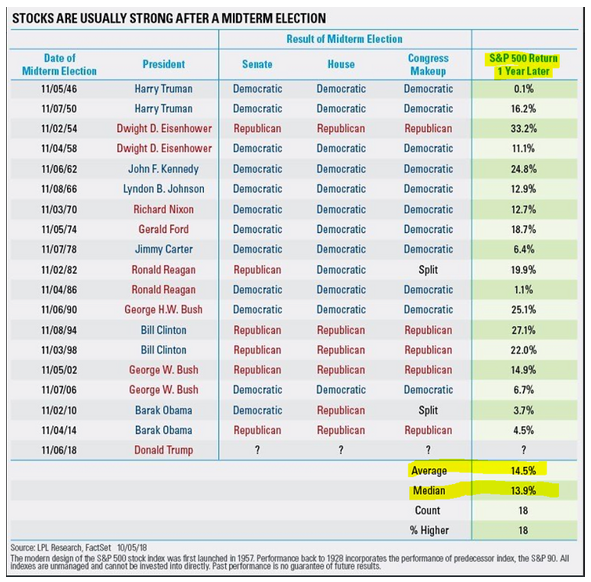
Source: LPL Research
The above graphic shows positive S&P returns for every 12-month period following midterm elections since 1946. You’ll notice it doesn’t matter which party is in power.
This isn’t to suggest the market cannot implode and take a negative turn. It certainly could. However, empirical evidence doesn’t support midterm elections and political dysfunction automatically spell trouble for the stock market. In fact, the market seems to reward the balance of power, gridlock, and political partisanship.
Remember, remember the 6th of November.