“The price of equity is determined in the same way that the price of everything is determined – via forces of supply and demand.” Jesse Livermore, famous investor.
Everywhere you turn, someone is making a loose prediction.
Most of the time, there’s no penalty for being wrong. Therefore, the more outlandish a prediction, the better publicity for the forecaster.
No one would blink an eye if I said the Brooklyn Nets are going to win the NBA title. But what if I go on national TV and say I’m betting my house on the Atlanta Hawks to win the NBA title? That might get some YouTube clicks and social media buzz.
In financial markets, Wall Street has made a living on predicting what happens next. Much of the time the forecasts are wildly wrong, but humans don’t care. We take comfort in feeling that someone knows what may happen next (even if they are full of it).
As the U.S. stock indices trend higher, many are asking the question: what are the prospects for future stock returns? Market participants point to popular metrics such as price to earnings (P/E), price to book value, price to sales, cyclically adjusted P/E, market cap to GDP, etc. for estimating future returns.
These metrics might have merit, but evidence would suggest Jesse Livermore has come up with the single best predictor of stocks returns. It’s amazingly simple and you’ve probably never heard of it.
Here’s an excerpt from Philosophical Economics, “The Single Greatest Predictor of Stock Market Returns,” (the post is long, but it’s definitely worth the read)…
“What would the average investor allocation to stocks be? And how would that average compare to the averages of the past? It turns out that this question predicts the market’s future long-term returns better than any other classic valuation metrics to date developed.”
Livermore’s conclusion was the higher the average investors’ equity allocation, the lower future stock returns. Conversely, the lower the average investors’ equity allocation, the higher future stock returns. Sounds overly simplistic, but the average investor equity allocation predictor has been extremely accurate…

Source: Philosophical Economics
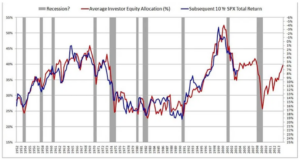
The above graph shows the average investor equity allocation (red line) and subsequent 10-year S&P 500 returns (1952-2013). Notice how the two lines track very closely to one another. This would suggest the relationships are positively correlated.
How does today’s average investor equity allocation stack up vs. history?

Source: Ned Davis Research
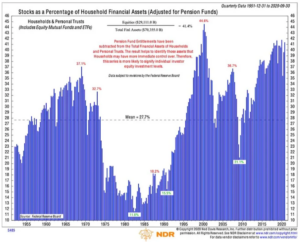
The above graph shows the equity allocation for U.S. households from 1951 to September 2020 (pensions have been stripped out). Looking at recent history, the early 90’s and post financial crisis (2008) U.S. households were massively underweight equities compared to the average or mean allocation of 27.7%. What followed were massive bull markets in both instances. On the flip side, in the late 90’s and mid 2000’s, U.S. households were significantly overweight equities compared to the mean allocation. Not surprisingly, these instances marked the market top.
What does that mean for future returns?

Source: Twitter User @churchesce Christopher Churches
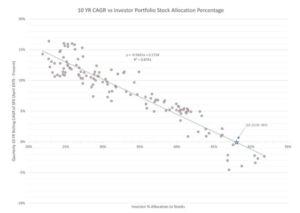
The above graph shows U.S. households have an average allocation of 48% to stocks, which is historically on the high end (90th percentile). From these allocation levels, 10-year returns (y-axis) for the S&P 500 (April 1979 to December 2020) have been a robust 0% per year.

Source: Twitter User @churchesce Christopher Churches
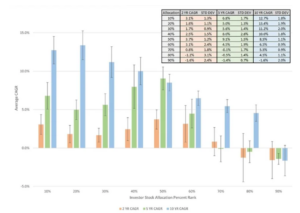
The above graph shows a breakdown of investor stock allocation (by percentile) and forward returns. The relationship is clear- when stocks are out of favor, future returns are highest. When stocks are in favor, future returns are lowest or even negative.
When someone asks, “what’s the market going to do next year?” they are really asking, how are human behavior and appetites for risk going to change? In my opinion, this is impossible to predict and can change overnight. The swiftness and intensity of the COVID sell-off being a fresh example.
Furthermore, many people point to low interest rates, Fed accommodation, fiscal stimulus, etc. as a reason that the market has ascended higher. Again, we refer to Philosophical Economics, “The Single Greatest Predictor of Stock Market Returns,” for an example of how powerful human risk appetite can be (he’s referring to the 1940’s)…
“Again, it’s all up to the allocators–they decide how much of their wealth they are going to allocate into stocks, how much exposure they are going to take on. Their preferences – or rather, their efforts to put those preferences in place, by buying and selling – set the price. Valuation is a byproduct of this process, not a rule that it has to follow. In the 1940s, investors decided, for whatever reason– memories of the Depression, a World War that the country might have lost, price controls, high inflation– that they didn’t want large stock market exposure. The fact that bond yields were meager did little to alter this preference. And so valuations stayed extremely depressed. When a vibrant, prosperous peacetime economy emerged in the 1950s, this preference obviously changed, and the biggest bull market in history ensued.”
So there you have it. The single best indicator of future U.S. stock returns is likely the average household allocation to equities. This isn’t to say you should sell all of your U.S. stocks, but rather that markets move in cycles. Easy periods are followed by not so easy periods. Human behavior and risk appetites can change quickly without warning. Investing is not as simple as piling money into the best performing assets, i.e. the S&P or FAANG, and extrapolating recent positive events perpetually into the future.
If you’re tired of owning cash or paltry yielding fixed income, the time to get more aggressive is when equities are deeply out of favor.
