“Housing is often found at the heart of financial crises”– Fed Chair, Jay Powell summer of 2017
We are not experts on residential housing by any stretch of the imagination. Nor do we have any grand prognostication as it relates to the U.S. housing market. Real estate is aunique asset class becauseof its decentralization. For instance, what’s true about the Portland market might be completely opposite of Cleveland. Demographics, corporate footprint, industry, taxes, quality of education, and general appeal of an area contribute to the dynamics of the local housing market.
Real estate ownership is woven into the fabric of the American dream. Some even say, the housing cycle is the economic cycle. We share our observations on the current state of housing in the United States. In graph heavy form, this is what has our attention…
Recent Home Data Coming in Soft
Source: YCharts
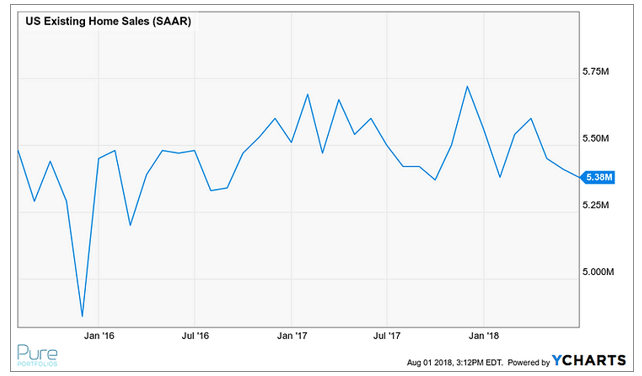
U.S. Existing Home Sales were down 0.55% from last month and -2.18% from one year ago.
Source: YCharts
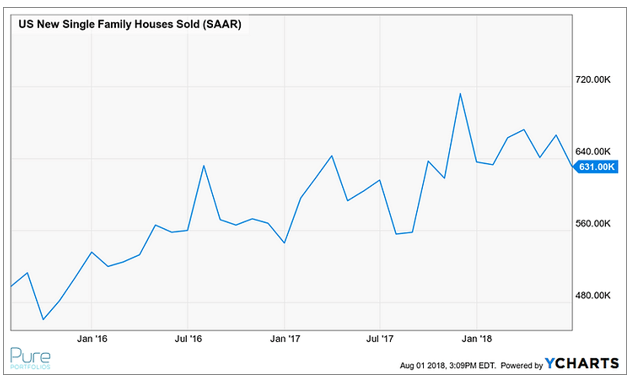
U.S. New Home Sales were down -5.26% from last month.
Source: YCharts
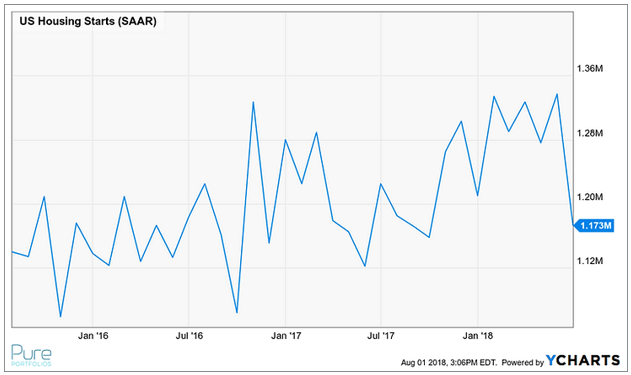
U.S. Housing Starts are down -12.27% from last month and -4.24% from one year ago.
The monthly housing numbers are noisy. They could be the canary in the coal mine or nothing.
Concern Level: Low
Urban Froth
Source: Wolfstreet.com
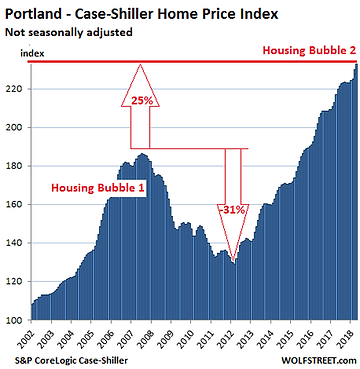
Favorable demographics have driven the Portland real estate market to new heights. The cheeky folks that created the popular TV show “Portlandia” refer to PDX as where “young people go to retire.”
Source: Wolfstreet.com
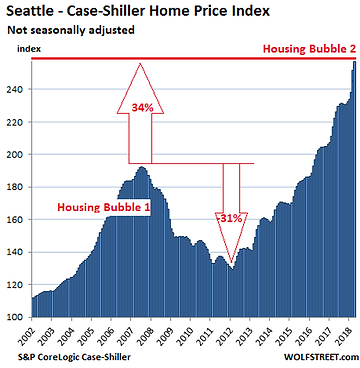
Big technology has anointed Seattle as one of the hottest housing markets in the country. Despite the influx of high-wage jobs and abundance of corporate HQ’s, Seattle real estate was not immune from the Financial Crisis in 2008.
Source: ScotiaBank, FHFA, Haver Analytics
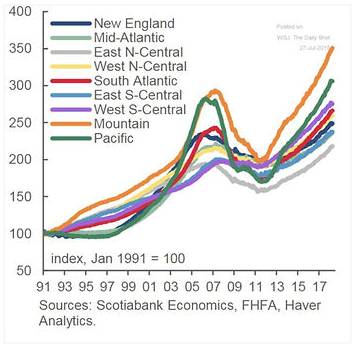
Regions west of the Rocky Mountains have led the charge, but housing gains have been broad based around the country.
Concern Level: High
Home Prices and Wages Disconnect
Source: Federal Reserve
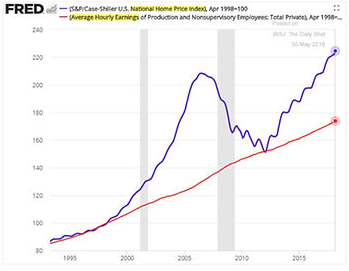
The above graphic is our personal favorite. The purple line shows the S&P/Case-Shiller U.S. National Home Price Index. The red line shows Average Hourly Earnings. Notice what happened after the large divergence in 2006-2007? The same gap is emerging in 2018. Runaway home prices and sluggish wages have historically not ended well.
Source: YCharts
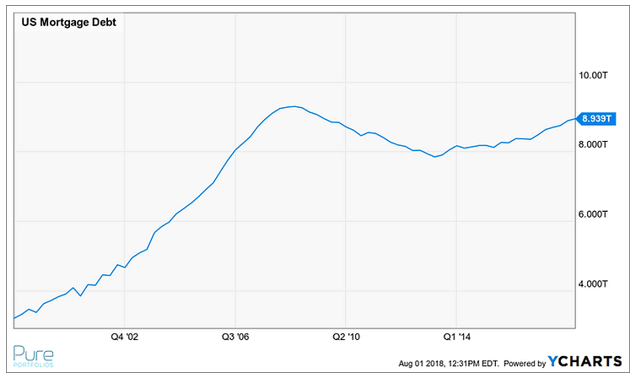
What fills this gap between home prices and wages? Lots of mortgage debt.
Home prices and wages have to converge. The widening gap is unsustainable. People work for wages. People use wages to buy homes. No wages, no homes.
Concern level: Extremely High
Fear of Missing Out
I listen to sports talk radio during my evening Portland to Vancouver, WA commute. During the 60+ minutes of plodding along, a blitz of ads from excitable mortgage lenders deliver a variation of the same message:
“Rates will continue to rise. Act now.”
“Lock in your rate before it’s too late.”
There are plenty of real estate agents and mortgage lenders that want what’s best for their clients. But at the end of the day, they get paid for transactions. They want you to do something. Act now, before it’s too late.
Concern level: Moderate
Cost of Money Ticking Higher

Source: Freddie Mac
The absolute level of mortgage rates is lower today than in 2007, but the path is very similar. Larger mortgage balances at a higher cost of money leaves a thin margin for life events (job loss, medical emergency, change in profession, etc.).
Concern level: Moderate
Homebuilding Stocks Kicked in the Teeth
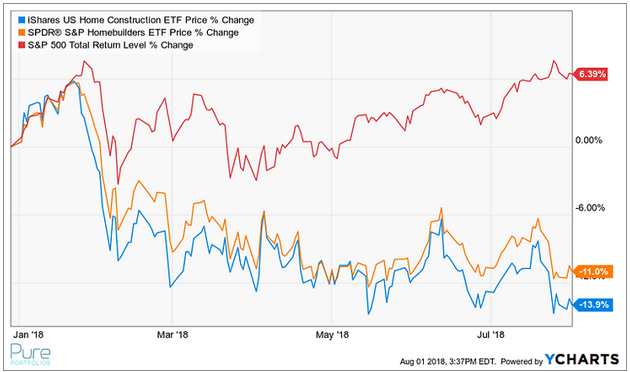
Source: YCharts
The orange and blue lines are exchange traded funds (ETFs) that own U.S. homebuilder stocks (the red line is the S&P 500). Financial markets are forward looking and are signaling trouble ahead for housing related stocks.
Frothy real estate prices and extended U.S. households are the unintended consequences of the Fed’s zero interest rate policy.
Cheap money incentivizes speculation, borrowing, consumption, and risk taking. We worry the same lessons will be taught to a new group of students.
