
“Emerging market economies have long grappled with the challenges posed by large and volatile cross-border capital flows.” – Jerome Powell, Chairman of the Federal Reserve.
Aside from the cycle defying U.S. equity markets, it’s been an ugly year for global equity investors. The divergence in returns has been stunning and the global growth story is on life-support. There is no shortage of reasons for the global pain including a stubborn Fed blindly raising rates, strong U.S. dollar, tariffs, sanctions, political dysfunction, etc.
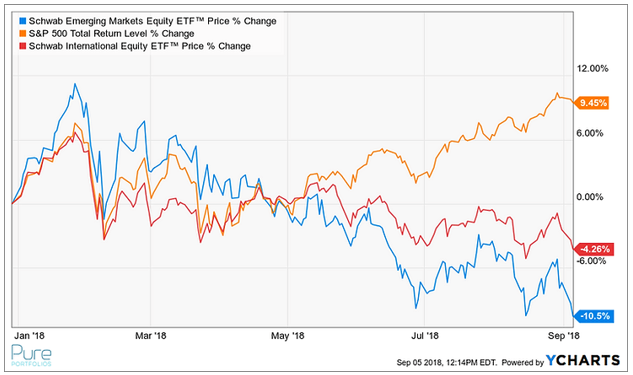
Source: YCharts
The divergence of between U.S. and global markets picked up in late February. Coincidentally, this is when trade war rhetoric began to heat up.
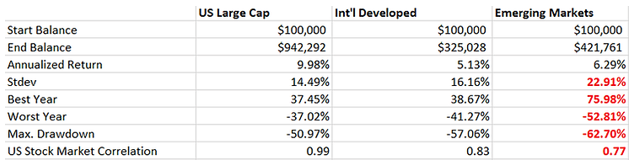
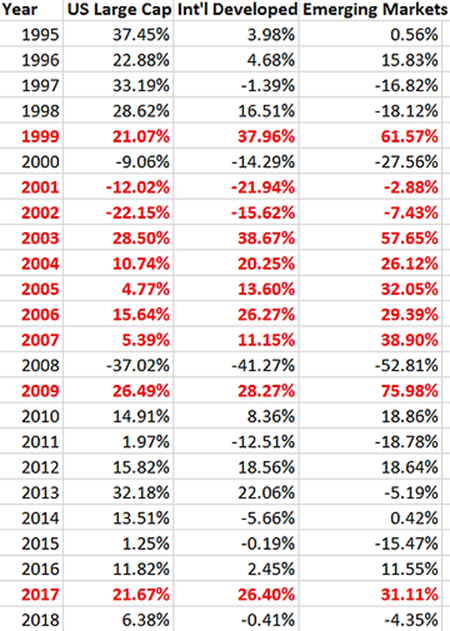
Looking at recent history, wild swings in emerging market equity returns are nothing new. In the above data, we back-tested U.S. Large Caps, International Developed, and Emerging Markets (EM) from 1/1/1995 to 7/31/2018. The red figures in bold show quite a large range of returns!
Source: Pension Partners
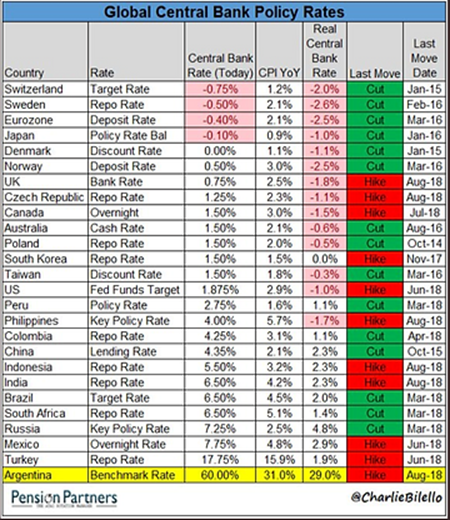
As the Fed raises short-term interest rates, global capital has poured into U.S. assets in search of safety, yield, and a resilient equity market. Critics of the Fed have argued there should be more coordination with other influential central banks to avoid policy errors or global disruptions.
Source: Pension Partners
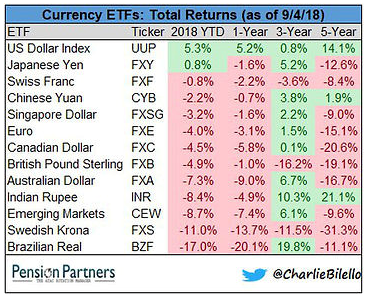
The easy money Fed policy of the past decade has created global imbalances and unintended consequences. According to the Bank of International Settlements, emerging market countries are sitting on $3.7 trillion in dollar-denominated debt. Imagine being faced with paying a debt off in dollars, but you get paid in a currency that is worth 20% less than it was 9 months ago (with no end in sight). That’s the dilemma many emerging market countries face as the U.S. dollar has appreciated in 2018.
Given the pain in Emerging Markets and to a lesser extent International Developed, why would an investor continue to own either?
Global Equities Act Differently
Source: PortfolioVisualizer.com
Going back to 1995, we highlighted (red) the calendar years where International & EM equities added significant excess returns. Of course, global diversification can move against an investor as outlined in the non-bolded years. Note: 2018 returns are through 7/31/2018.
Current Valuations + Future Return Expectations
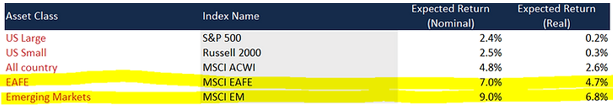
Source: Research Associates
Our friends at Research Associates publish 10-year future return expectations for every major asset class. The projections are based upon current valuations, interest rates, and inflation to build optimal portfolios for the next market cycle. You can see International Developed (EAFE) and Emerging Markets have the highest expected returns over the next 10 year period. We should note that the tool is simply an exercise and states nothing about timing. As investors, we know markets can be stubborn and defy even the most logical forecasts.
Forecasting Asset Class Returns is Hard
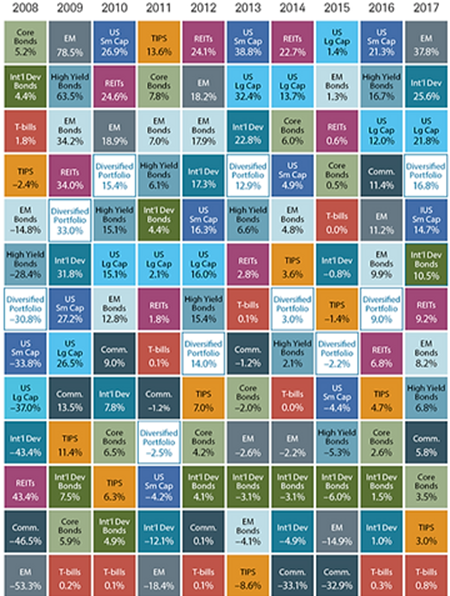
Source: Charles Schwab
The above graphic stacks the best performing asset classes by year. Keeping with the EM theme, we can see that EM equities posted the best returns in 2009 +78.5%. Two years later in 2011, EM equities posted the worst returns -18.4%. The random assortment of colors tells the story that projecting asset class returns from year to year is extremely tough.
Globally diversified investors have certainly felt the drag of under-performing international and EM stocks. As recent history has shown, deep drawdowns in EM are not uncommon. However, empirical evidence suggests that foreign equities provide diversification benefits and current valuations/future return expectations look attractive.
Short-term, there could be more immediate pain ahead for foreign equities. Looking out over the long-term (10+ years), one could make a strong case foreign equities should represent a hefty percentage of a multi-asset portfolio.