“Being scared of everything is a symptom of being addicted to comfort.” – Orange Book, @orangebook on Twitter
Post World War II, the U.S. has experienced 12 recessions. The math works out to one recession every six years.
Are we approaching a 13th?
No one knows, but the recession drumbeat is growing louder.
In the following post, we discuss…
- The link between energy prices and recessions.
- The link between wheat prices and recessions.
- The odds of a recession.
Commodity Shocks and Stock Prices Don’t Jive
Source: Bespoke Investment Group
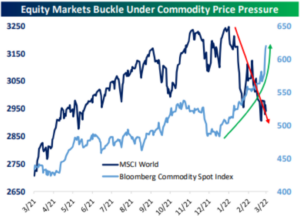
The above chart shows the MSCI World Index (dark blue) and the Bloomberg Commodity Spot Index over the past year. There’s a clear inverse correlation between rapid spikes in commodity prices and lower stock prices.
Wheat Could be a Bigger Deal than Energy
Source: Bespoke Investment Group
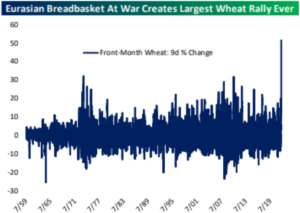
The above graph shows the unprecedented spike in wheat prices. Russia and Ukraine are the biggest global exporters of wheat, directly impacting food prices around the world. Energy is getting most of the attention, but wheat supply disruptions could be a bigger problem.
Source: Pure Portfolios, Koyfin
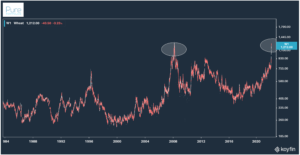
The above graph shows wheat prices (1984 – March 2022). The last time we saw global wheat prices this high was during the 2008 financial crisis. We need to be careful of misguided cause and effect, higher wheat prices were the symptom of the crisis rather than the disease.
Source: Bespoke Investment Group
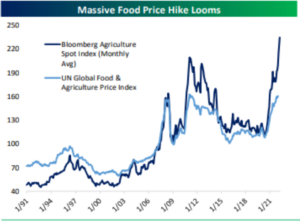
The above graph shows how closely the Bloomberg Agriculture Spot Index (dark blue) and the UN Global Food & Agriculture Price Index (light blue) move together. Higher food prices could cause social and political instability in developed and emerging countries.
Energy Still Matters
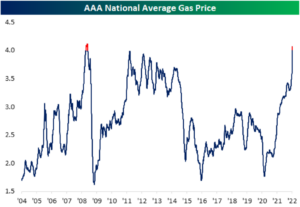
Source: Bespoke Investment Group
The above chart shows the AAA National Average Gas Prices. Mature economies have made progress developing clean energy solutions, but oil still matters. The U.S. is already dealing with inflation issues; the spike in gas prices adds fuel to the fire (pun intended).
Are We Headed for a Recession?
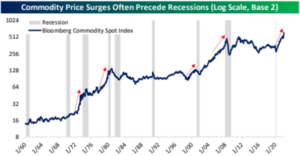
Source: Bespoke Investment Group
The above graph shows the Bloomberg Commodity Spot Index (blue line) with recessions in light gray vertical columns (1960 – 2022). Nothing is certain, but there seems to be a relationship between commodity cycle peaks preempting U.S. recessions.
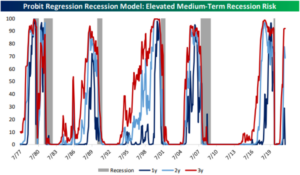
Source: Bespoke Investment Group
The above graph is the Probit Regression Recession Model (data from 1977 – 2022). The lines moving higher indicate the higher risk of recession over one year (dark blue), two year (light blue), and 3 year (red) periods. The gray column highlights actual recessions.
Looking at the far right, the odds of a recession over the next year are ~25%, the next two years ~80%, and the next three years ~90%. The odds of a recession in the near term are low, but are much higher over the next 2-3 years. *This is just a model, these projections are subject to error and can change quickly*
Let’s say we are headed for a recession. Rather than trying to predict when it starts, ends, and what happens to stock prices, we can concede that everyone will feel some pain.
The question becomes, how can we mitigate the damage?
Next week’s post will cover things you can do today to mitigate damage during the next recession.
