“Inflation is when you pay $15 for a $10 haircut you used to get for $5 when you had hair.” – Sam Ewing, retired professional MLB player.
Inflation is the topic de jour. Everyone has their own personal experience with inflation. Recently, I had someone proclaim inflation is out of control because bananas cost $0.50 more at the grocery store. To them, it was clear evidence that inflation was, is, and will continue to be a problem.
The messy part about inflation (there are many), is it’s not a centralized phenomenon. What’s true in South Florida might not be true in South Dakota.
So, what’s a proper barometer for inflation?
In our opinion, the old dinosaur 10-year U.S. Treasury is as good as any. Remember, inflation isn’t the primary risk per se, rather it’s unexpected inflation that’s a problem. In other words, inflation that is out of whack with what the market is pricing in.
We aim to evaluate the relationship between the UST 10-year and periods of high inflation.
Why do we care what the 10-year Treasury says?
- Bond investors are among the sharpest on the planet. Think big institutional money i.e. insurance companies, pension funds, endowments, foundations, professional money managers, hedge funds, etc.
- Movements in the 10-year are heavily influenced by future growth and inflation. Short-term rates are controlled by the Fed (although you can argue that the Fed is gaining influence over every part of the yield curve).
- Bond investors are heavily affected by changes in the purchasing power of future cash flows.
Here’s a practical example on the tight relationship between bonds and inflation:
Bush lends money to the U.S. government for 10 years.
Bush receives a U.S. government bond.
Bush will receive interest payments for the next 10 years.
During the ten year period, inflation is higher. Goods and services cost more.
Bush’s future interest payments are worth less, because they buy less goods and services.
Bush’s bond must go down in value for the above reason.
The U.S. government now must pay new investors a higher amount of interest to compensate for higher inflation.
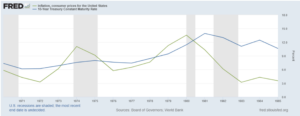
Here’s the relationship between bond yields and inflation in action. Inflation was increasing at a rapid rate between 1977 and 1981…

Source: St. Louis Fed, Board of Governors, World Back
The above chart shows inflation (CPI, green line) and the 10-year treasury constant maturity yield from 1971 to 1985 (blue line). Inflation was increasing at a rapid rate between 1977 and 1981 and the 10-year Treasury yield adjusted higher to compensate bond investors for a reduction in purchasing power.
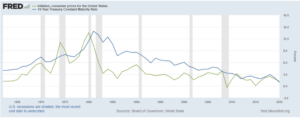
When you expand the time series, the positively correlated relationship between the 10-year yield and inflation is clear…

Source: St. Louis Fed, Board of Governors, World Back
The above chart shows inflation (CPI, green line) and the 10-year treasury constant maturity yield since 1965 through 2020. Historically, as inflation creeps higher, bond yields follow and vice versa.
What is the 10-year Treasury yield saying about inflation today?
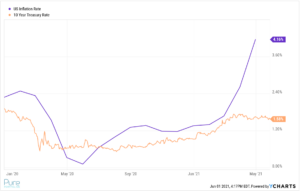
Let’s just say the bond market doesn’t buy the systemic, widespread inflation narrative.

Source: YCharts
The above graph shows the 10-year Treasury yield (as of 6/1/2021) and U.S. inflation (CPI, purple line). You can see the historically tight relationship between bond yields and inflation has decoupled. Either the bond market is wrong or the market is expecting inflationary pressures to subside as things get back to normal.
It seems many economists, analysts, and investors are being influenced by base effects. We are arguably coming off the most ridiculous year in our lifetime. Everything from supply chains, economic growth, and labor markets are mucked up. It could be a mistake to make absolute conclusions coming off of a messy base. Many are using transitory supply chain disruptions to extrapolate future systemic inflation.
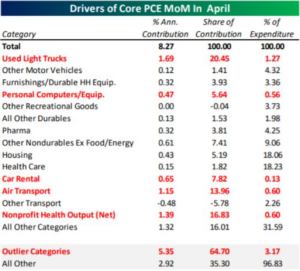
That doesn’t mean there aren’t pockets of inflation. There are certainly areas of the economy that are out of whack…

Source: Bespoke Investment Group
The above graphic shows personal consumption expenditures for the month of April. The red highlighted areas are categories that saw a sizable jump in price. Many of the outsized increases are due to the semiconductor shortage and/or the reopening of the economy.
If I had to bet whether the bond market is wrong or inflation subsides as things get back to normal (the bond market is right), I would bet on the latter every single time.
Like our writing and want to learn more? Check out our free portfolio analysis service.
