
“I’m an optimist, both as a person and an investor. It’s a big mistake to be pessimistic as long as we have a viable civilization which is reasonably well managed.” – Philip Carret, Founder of Pioneer Investments.
To some, it’s obvious the market is in a bubble. It’s only a matter of time before it pops. They have been sitting in all cash since mid-2020, waiting for the market to crash to get fully reinvested.
Adding fuel to the argument, basically every historical valuation metric is flashing yellow or red.
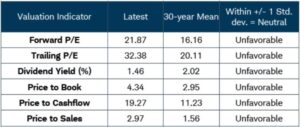
Source: Schwab, Bloomberg
The above chart shows popular valuation metrics for the S&P 500 (as of 3/31/21) for the past 30 years. The latest readings (second column) are historically elevated relative to the 30-year average.
Let’s say these people are right. The market is due for a correction, maybe even a steep repricing of risk. Which begs the question(s), what does a bear market actually look like? How frequently do they occur? Are the people who sit in 100% cash for months on end, waiting for the market to drop savvy investors or bag holders?
Here’s a rough overview of bear market characteristics…
- Arbitrarily defined as a -20% drawdown. There’s nothing sacred about 20%, it’s just a widely accepted bear market threshold.
- Bear markets occur roughly once every five years.
- No two bear markets look the same. 2020 was perhaps the oddest looking bear of all-time.
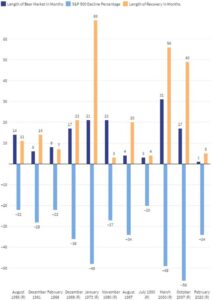
Source: LPL Financial
The above graph shows bear markets for the S&P 500 since 1956 (the (R) marks a recession). The dark blue bar represents the length in months, light blue is the decline percentage, orange is the length of the recovery in months (getting back to pre-bear market levels). Look at the gaping difference between 2020, March 2000 & October 2007!
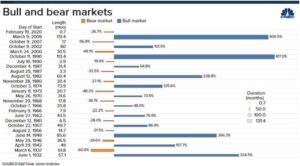
Source: S&P Dow Jones Indices
The above is a slightly different format going back to the early 30’s. This provides good insight into bear markets and bull markets. Notice how bull markets tend to run for a longer period of time and have large positive skew.
For bear markets, some snap back quickly (2020). Others take multiple years (1973). Some suffer steep losses >50%. Others are quite shallow ~20%.
From an emotional standpoint, during a bear market, it seems like the world is going to end.
After a bear market, it seems like it was an obvious buying opportunity and the bounce back was inevitable (also known as hindsight bias).
In my opinion, the fear of the bear is often worse than the bear itself.
Consider what the bearish investor is up against…
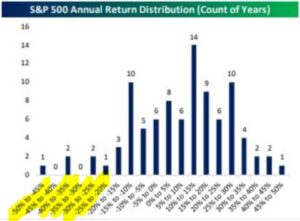
Source: Bespoke Investment Group
The above graph shows the frequency of returns for the S&P 500 since 1928. For example, a flat or modestly higher S&P, measured by returns between 0-5%, is relatively uncommon, occurring eight times over the past ~90 years. Steep losses are also rare, as the S&P 500 posted returns worse than 20% only six times over the past 90 years.
We previously mentioned positive skew for the U.S. stock market. This is quite noticeable in the above graphs. There are 39 observations of the S&P posting returns between 10-30%. While some would point to double digit return years as a sign of an unsustainable market rise, the result is more common than you might think.
If you’re pounding the table for a massive correction, it would seem history is not on your side.
Here’s how we would balance out a bearish disposition…
- Negative outcomes are part of investing. In our opinion, something weird is going to happen ~every five years or so. Once you accept this simple truth, investing becomes much more simple. Stop playing the oracle and start compounding.
- If you’re convinced a bear is coming, here’s how you can mitigate damage without placing a trade. Turn your focus inward and optimize what you can control.
- Keep your identity small. Don’t identify as a market bear/bull. Stay nimble and be able to change your mind.
- Be honest about your blind spots and disposition tendencies. If you’ve been incorrectly predicting a market meltdown for a decade, it might be time for honest self-assessment and reflection (see Pure’s self-assessment during the 2020 bear).
- Self hedge. If you are convinced the market is going to crash, hedge against being wrong by owning equities. If you’re overly bullish, hedge against being wrong by owning bonds. Avoid the extremes, both in disposition and allocation.
It’s easy to dwell on what could go wrong. But it’s also important to see what could go right.
For more reading on this topic, see Investor Behavior During COVID Sell-Off & Bear Market Blind Spots