“In my experience, most people who are lucky enough to sell something before it goes down get so busy patting themselves on the back, they forget to buy it back.” – Howard Marks, Oaktree Capital
We recently shared professional investors favorite asset class is cash. The CNBC survey indicated 70% of respondents thought the S&P 500 could see declines ahead.
In our client circle, more folks are inquiring about CD rates, short-term U.S. Treasury yields, and high-yield savings accounts.
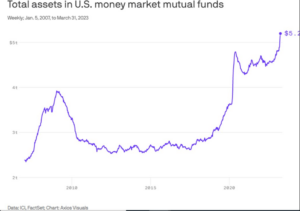
U.S. money market asset flows back this up…

Source: ICI, FactSet, Axios Visuals
The above graph shows the assets of U.S. money market funds (in trillions) as of 3/31/23. Over the past year, money market fund assets have swelled to $5.2 trillion.
It seems everyone loves cash while being down on stocks.
I’m reminded of Bob Farrell’s quote regarding the herd consensus in investing…
“When everyone agrees, something else happens.”
Look, we encourage building a portfolio that reflects the way you feel about risk. Even better if you have a risk management process in place. However, the rush to find the highest yielding money market fund feels different.
There’s a fine line between prudence and making knee-jerk, emotional decisions.
Similar to our post about bond returns following difficult years, we wonder…
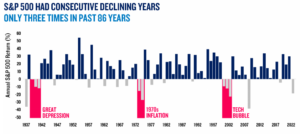
How common are back to back or multi-year losses for the S&P 500?
Let’s cue up the data going back to 1937.
1939: -5.45%
1940: -15.29%
1941: -17.86%
1973: -17.37%
1974: -29.72%
2000: -10.14%
2001: -13.04%
2002: -23.37%
The answer? Not very common.
According to Morningstar & PGIM Investments, the S&P 500 posted consecutive or multi-year losses three periods in 86 years.

Source: Morningstar (returns through 12/31/22), PGIM Investments
The above graph shows S&P 500 returns over the past 86 years (through 12/31/22). The red bars represent periods of back to back or multi-year declines. The S&P 500 posted consecutive declining years only three times over the past 86 years!
———————————————————————————————————————————–
A few observations from the above data set…
- Stocks can post consecutive or even multi-year declines.
- Stocks posting consecutive or multi-year declines are infrequent, occurring three times over the past 86 years.
- Negative outcomes are part of investing. The S&P 500 had calendar year losses 24% of the time over the past 86 years (21 out of 86 years saw negative returns).
- The S&P 500 gained 15%, on average, in the year following its 21 negative calendar years. (Source: PGIM Investments).
- As the U.S. economy has matured, market declines have become less clustered.
- Stocks historically have had a positive skew distribution. This means there are more instances of positive outcomes than negative outcomes.
- Poor market returns can give way to better market returns. Good market returns can give way to poor market returns.
- Stock returns can swing wildly from year to year. For example, in 2008 the S&P 500 fell ~38%. The following year, the S&P 500 was up ~23%.
———————————————————————————————————————————–
But Nik, this time things are different.
Perhaps…
Go back through history and rattle off all of the things people were worried about in the 30’s, 40’s, 50’s, etc. There’s always going to be a trove of potential economic and market issues that pop up. The premise of waiting for things to calm down paving the way for uninterrupted gains doesn’t exist.
In my opinion, it’s important to understand human psychology, historical context, and investor sentiment to unpack what’s going on in financial markets.
We’ve been focused on market history because it feels like I’m fighting a doomsday propaganda machine. The number of “the end of the world” emails we receive is at an all-time high (no period is even close, I’ve been doing this almost 20 years).
It’s important to understand what could go wrong, but it’s equally important to understand what could go right.
If you’re a market pessimist, you might balance things out by reading…
“Bond Returns Following Difficult Years”
