“Bull markets ignore bad news, and any good news is reason for a further rally.” – Colm O’Shea, professor at New York University
The latest market correction shook investors. Many are wondering if it marks the end of the bull market.
A bull market is defined by a 20% upswing in stock prices. We technically entered a bull market the fourth quarter of 2022.
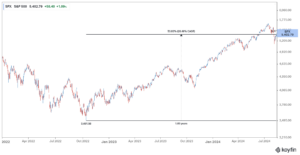
Source: Koyfin
The above graph shows the S&P 500 from the October 2022 low to current levels (as of 8/13/24). It may not feel like a bull market to some, but the current cycle is approaching two years.
Rather than make loose predications on what happens next, we examine characteristics of a bull market to understand where we’re currently at in the cycle.
Slow Melt Up
The average bull market isn’t exciting. It’s actually quite boring…
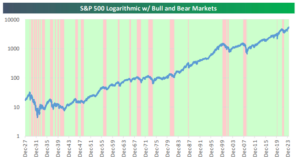
Source: Bespoke Investment Group
The above graph shows every bull (green) and bear (red) market since 1927. Most bull markets are slow melt-ups over a long stretch of time. Conversely, bear markets are short and painful. Notice how bear markets have seemingly become less frequent post-1980 as the U.S. economy has matured.
Bad News is Shrugged Off
You can make a smart sounding argument why the market is due for a correction. This has been true since the 1900’s…
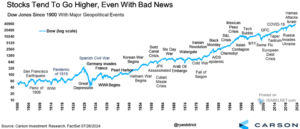
Source: Carson Investment Research
The above chart shows the Dow Jones (1900 – 2024) and major geopolitical events. Headline risk can move markets in the short-term, but it’s not uncommon for stocks to climb the wall of worry.
Falling Inflation
We wrote about “Falling Inflation and Stock Returns,” a few months before the market bottomed in October 2022…
- While inflation is still elevated, no one is talking about the gradual fall of CPI.
- In prior periods when year-over-year CPI declined by a similar or larger magnitude, S&P forward returns were overwhelmingly positive.
Over the last ~80 years, falling inflation has been a tailwind for stocks.
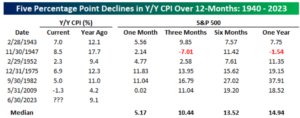
Source: Bespoke Investment Group
The above data set shows S&P 500 returns when inflation (consumer price index, CPI) falls by 5% over the previous 12 months. One year returns for the S&P 500 average ~15% when inflation falls by 5% or more.
The above data cuts off June 2023, but an updated chart would show falling inflation has been a constructive backdrop for stocks the past 12 months.
Low Volatility
There are painful days in a bull market, but they seem to be few and far between…
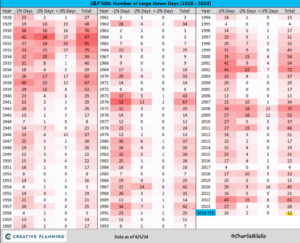
Source: Creative Planning, Charlie Bilello
The above chart shows the number of large down days for the S&P 500 since 1928. Even with the latest bout of market disruption, 2024 still registers as quite calm relative to history. Low volatility and a steady march higher are a staple of bull markets.
All-Time Highs
The trend is your friend. All-time highs are a normal feature of bull markets…
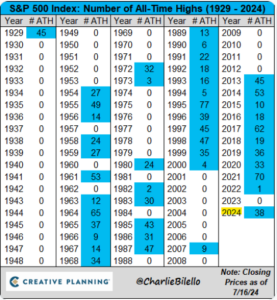
Source: Charlie Bilello, Creative Planning
The above chart shows the number of S&P 500 all-time highs since 1929. For those that are ‘waiting for a correction’ to put cash to work, it would seem all-time highs often lead to more all-time highs, especially during a bull market. In 2024, we’ve hit 38 all-time highs (as of 7/16/24)
Tight Credit Spreads
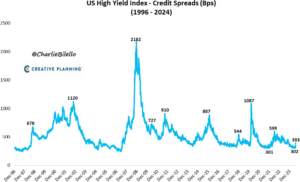
Source: Charlie Bilello, Creative Planning
The above chart shows high-yield bond credit spreads (1996-2024). Credit spreads measure the yield premium an investor would demand over a “risk-free” bond. The higher the spread, the more an investor would demand in yield to own a bond. In general, tight (low) spreads can be seen as a signal of economic stability, while higher spreads may signal economic stress and/or recession.
Length
The average bull market usually lasts about three years…
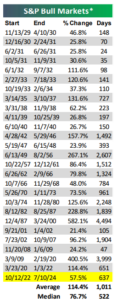
Source: Bespoke Investment Group
The above graphic shows the average length (days) and gain for a bull market (S&P 500). The current bull is about 670 days with a percent gain of 54%. If the current bull ended today, it would fall short for both average gain and length.
We caution it’s impossible to know how this bull market cycle plays out. As we’ve seen in the past few weeks, market dynamics can change quickly.
In summary…
- Bull markets historically tend to shrug off bad news
- Falling inflation has been seen as encouraging for stock prices (especially coming from high levels of inflation)
- Volatility tends to be lower during bull markets
- All-time highs can lead to more all-time highs
- High yield credit spreads are low and stable
- The average length of a bull market is ~3 years, with an average gain of 114%
Many of the historical characteristics of a bull market remain intact today. In our opinion, taking cues from the market is better than gut feelings, fancy narratives, doomsday predictions, and emotion when making investment decisions.
