“History doesn’t repeat, but it often rhymes.” – Mark Twain
Anyway you slice it, the S&P 500 is historically expensive.
The conundrum for those waiting for a correction is the S&P 500 has been expensive for the better part of the past 10 years, yet keeps going higher.
Can the S&P 500 continue its torrid pace, or will future returns be lower or even negative?
We wouldn’t bet against the ingenuity of U.S. corporations, but the set up for the decade could leave investors disappointed.
Source: Bespoke Investment Group
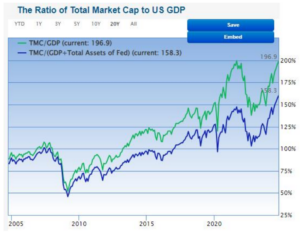
The above graph shows the total market cap (the value of all U.S. public companies) relative to the value of the U.S. economy (measured by GDP or Gross Domestic Product). The ratio is Warren Buffett’s favorite market valuation measure. The higher the ratio, the more ‘overvalued’ U.S. stocks.
The current reading of total market cap to GDP is ‘significantly overvalued…’
Source: Bespoke Investment Group
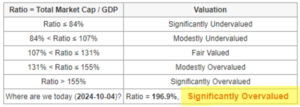
The above graph shows the valuation ranges for total market cap/GDP ratio. In general, the lower the ratio, the more attractively valued U.S. stocks, which could lead to higher future returns. At current elevated reading, many institutional investors think U.S. large cap stocks could see muted returns going forward. It shouldn’t be a surprise that Buffett’s Berkshire Hathaway is sitting on record levels of cash!
What about U.S. stocks share of global market cap?
Source: Bespoke Investment Group
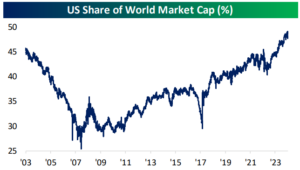
The above graph shows U.S. companies share of the world’s total stock market value. The higher the reading, the greater the percentage of U.S. company dominance relative to the rest of the world. U.S. equities are approaching a 50% share of global market cap mark, which would be a record dating back to 2003.
What about the handful of companies dominating the S&P 500 index weighting?
Source: Bespoke Investment Group
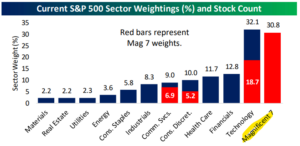
The above graph shows the Magnificent 7’s weights by sector and index level (red bars). The S&P 500 Technology sector now has an index weight of 32.1%, which is only a few points away from the peak of 34.9% in 2000. The index is heavily concentrated in the mega caps with the Magnificent 7 accounting for a 30.8% weight in the S&P! This is a double-edged sword. While the rallies in these stocks have bolstered market returns, it poses a major risk if these stocks roll over.
What could S&P 500 concentration mean for future returns?
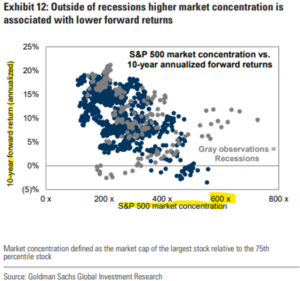
The above chart shows S&P 500 concentration levels (bottom axis) and 10-year forward annualized returns (vertical axis). The higher the concentration factor, the lower the future 10-year annualized returns for the S&P (blue dots clustering around the gray line).
Can investor behavior offer insights into future S&P 500 returns?
According to J.P. Morgan, individuals move more money into investment accounts following sustained market gains.
A Vanguard survey showed investor return expectations for U.S. large cap stocks at 7.9% per year. This is an all-time high reading in the survey.
Performance chasing and all-time high return expectations isn’t a good recipe. The data shows U.S. household stock ownership is at cycle highs…
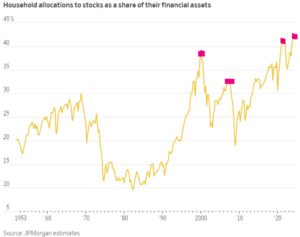
The above graph shows U.S. household allocations to stocks as a percentage of their financial assets. In our opinion, this is a very powerful indicator for future equity returns (we wrote about it here). Investors tend to crowd into stocks when times are good, which often leads to market peaks and lower future returns.
It would seem there’s plenty of evidence to suggest future S&P 500 returns could be lower (or even negative).
Where could the ‘lower future returns’ narrative be wrong?
Valuation is a lousy timing tool. Many folks have been pounding the table for lower or negative S&P 500 returns for years. They’ve all been wrong (and it has cost them money). What’s overvalued can stay overvalued for a long time.
This isn’t a 2000 redux. The S&P 500’s ascension has been powered by earnings growth. According to Charlie Bilello, the combined revenue of Amazon, Apple, Google, and Microsoft is $1.6 trillion. To put that ridiculous number in perspective, that’s bigger than the GDP of all but 15 countries.
This isn’t to say if the S&P 500 is challenged going forward investors have hit a dead end. If history is a guide, investors could do well to downshift their return expectations for U.S. mega caps. That might mean reducing U.S. large cap concentrations, adding to other equity asset classes (small cap, value, real estate, foreign), or rebalancing.
We aren’t sounding the alarm on the S&P 500, rather, the only certainty in financial markets is change. In our opinion, what outperforms the next 10 years is likely to look different than what outperformed over the past 10 years.
