“Fear, greed, and hope have destroyed more portfolio value than any recession or depression we have ever been through.” – Jim O’Shaughnessy, Financial Author & CIO of O’Shaughnessy Wealth Management.
The dreaded ‘R’ word has been all the buzz lately. It started with the yield curve inversion in early December. Now the talking heads won’t shut up about it. Everyone is asking a variation of the same question, are we headed for a recession? What does it mean for the financial markets?
Those are loaded questions, and you won’t find meaningful answers on WWE-esque financial TV. First, let’s look at recent history for some sobering context on economic cycles.

Source: Bespoke Investment Group
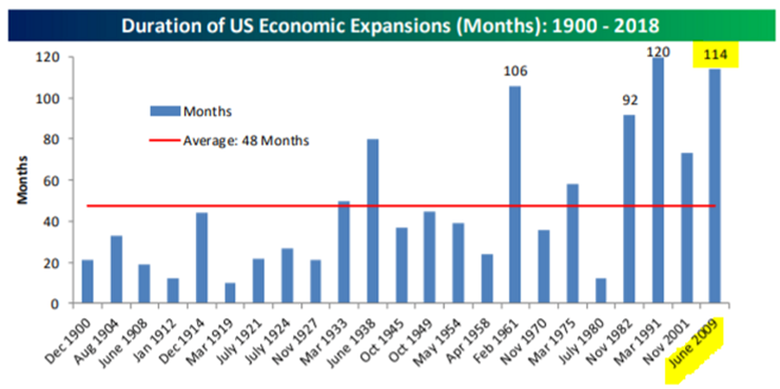
The above graph shows every U.S. economic expansion since 1900. Currently, we are in the second longest economic expansion in history (114 months and counting!). Only the booming 1990s at 120 months was longer.
Post WWII, the U.S. has had 12 recessions with an average length of 10.8 months, or about once every six years. One could argue that the Fed has extended (and mucked up) this business cycle by keeping interest rates artificially low. Now it feels like the Fed is playing catch up i.e. raising interest rates in the face of economic weakness. We are reminded by our friend David Rosenberg, Chief Strategist at Gluskin Sheff, that recessions often start with the Federal Reserve:
“Just remember that 10 of the last 13 Fed hiking cycles have been miscalculations that ended in recession.”
It doesn’t take a Nobel Prize winner to state the U.S. is overdue for a recession based on recent history. To be candid, we are shocked there is a sense of surprise that a recession is a very real possibility. It’s almost as if the length of the current expansion has erased economic pain as a potential outcome from investors’ memory banks.
Pivoting to the financial markets, let’s look at S&P 500 returns after a large economic expansion and during recessionary periods.
Keep in mind, financial markets are forward looking and often react poorly before economic conditions worsen. As a matter of fact, it’s not uncommon for markets to dip during times of economic prosperity.

Source: Bespoke Investment Group
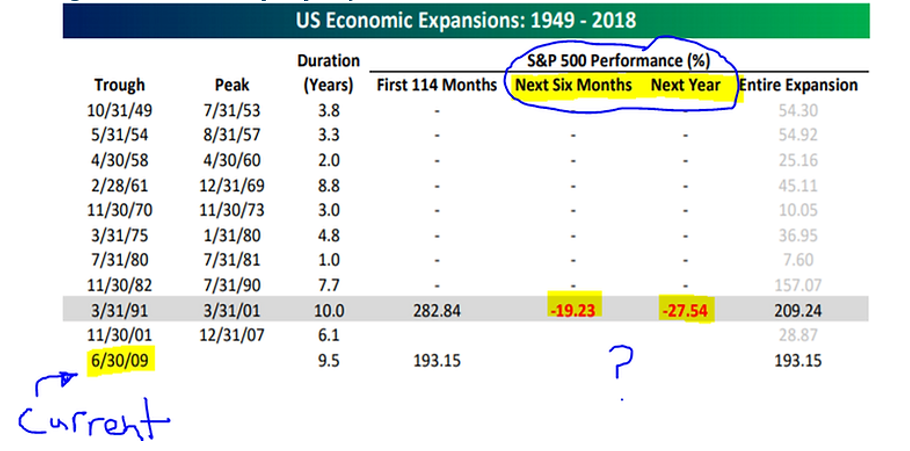
The above graphic shows S&P 500 performance after the longest economic cycle on record (3/31/91 to 3/31/01). You can see the next six months -19.23% and next 12 months -27.54% after the expansion ended were quite ugly. We are currently in our 10th year of economic expansion (6/30/2009 to ?) with no immediate economic signal of a recession.
Let’s say we do get a recession. How have the U.S. markets held up? If you don’t mind a bit of violence peak to trough, surprisingly well…

Source: Bespoke Investment Group
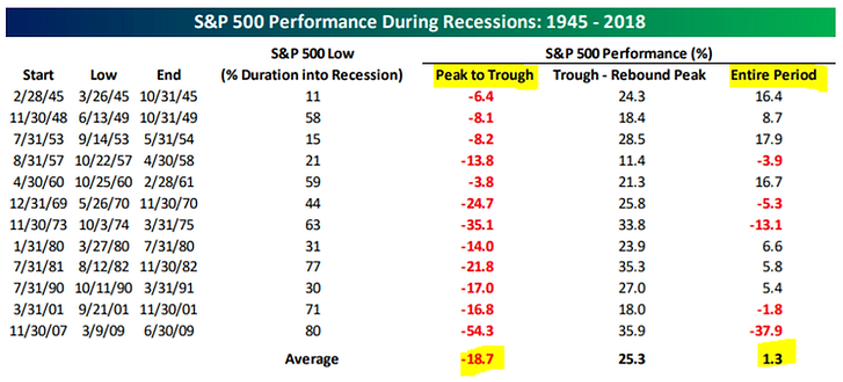
The above graphic shows S&P 500 returns through every recession since 1945. From peak to trough, the average decline was -18.7% (the worst peak to trough was the Financial Crisis from 11/30/07 to 6/30/09 the S&P 500 lost -54.3%!). Surprisingly, S&P 500 returns were actually positive on average, +1.3%, during recessionary periods post WWII. Of course, this assumes the investor was able to hold on and weather some violent peak to trough moves. Easier said than done!

Source: Bespoke Investment Group
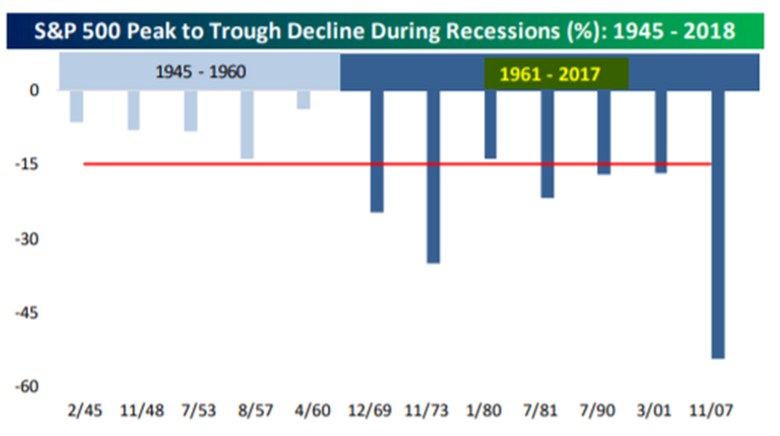
The above graph shows S&P 500 peak to trough declines during recessionary periods. You can see the more recent drawdowns, 1961-2017, have been less frequent as the U.S. economy has matured, but much more dramatic on the downside.
Cliff notes:
- Financial media will continue to spew story-based nonsense. Turn off the TV. If you must watch, turn off the sound.
- We are in the second longest expansion in U.S. history. We are overdue for a recession.
- A recession and a move lower in the stock market as a possible outcome should not come as a shock (see previous bullet point).
- S&P 500 returns are actually positive (on average) during recessionary periods post WWII, although the ride can be uncomfortable.
