“Everyone is a genius in a bull market.” Mark Cuban, entrepreneur and owner of the Dallas Mavericks.
There’s no shortage of investors & pundits telling us what happens next for stock prices (see Tis the Season for Wall Street Forecasting Pt. V).
Markets cannot go up forever and there’s a growing trove of investors that are waiting for things to get ugly.
These predictions are heavy in emotion, past scars, personal experiences, and gut instinct.
We prefer historical context and evidence.
How does the current bull market stack up vs. other recent bull markets?
We explore the raw numbers and three stages of a bull market by investor sentiment.
*The COVID selloff of spring 2020 was technically a bear market (defined by a -20% correction). Thus, the market ascension from the COVID low to current prices marks a new bull market cycle.*

Source: Bespoke Investment Group
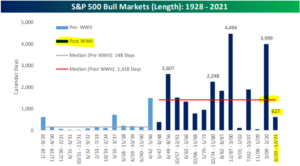
The above graph shows the length of every S&P bull market since 1928 (we will focus on the post-WWII era). The median length of a post-WWII bull market is 1,418 days. The current bull market, 3/20 – 12/21, is ~627 days and counting.

Source: Bespoke Investment Group
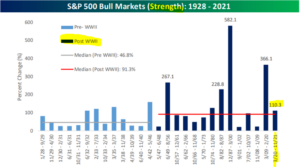
The above graph shows the strength (measured by percentage return) of every S&P bull market since 1928. The median S&P return post-WWII is 91.3%. The current bull cycle has been shorter and stronger compared to other recent bull cycles. The disjointed economic recovery and the speed of the market bounce back has confounded investors.

Source: Bespoke Investment Group
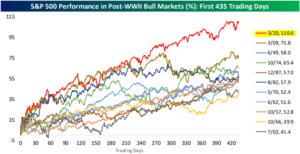
The above graph shows S&P 500 performance (post-WWII) for the first 435 trading days of various bull markets. Piggybacking off the last graph, the condensed time frame and speed of the current cycle (red line) has been unprecedented.
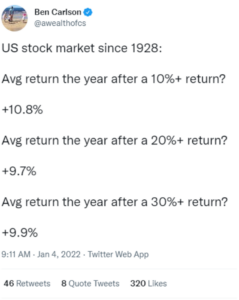
There’s a faction of investors that believe because the market was up the previous year, the following year is due for a correction. That could certainly happen in 2022, but a solid year of equity returns isn’t a reason to get pessimistic. Ben Carlson, author of the A Wealth of Commonsense blog, debunks this common narrative via Twitter…

Source: Ben Carlson Twitter
The above tweet shows average returns following a 10%, 20%, and 30% return the previous year (1928-2021). Not to imply markets will always trend positive year over year, but using the previous years gains to make a bearish case hasn’t worked out too well.
On the human side, how investors feel has a huge impact on stock prices.
Howard Marks of Oaktree Capital brilliantly captures the essence of investor sentiment and various stages of a bull market…
“The first, when a few forward-looking people begin to believe things will get better. The second, when most investors realize improvement is actually taking place. The third, when everyone concludes things will get better forever. Why would anyone waste time trying for a better description? This one says it all. It’s essential that we grasp its significance.”
Notice the above mentions nothing about inflation, interest rates, the Fed, earnings, politics, etc? Changes in stock prices are linked to the ebb and flow of investor appetites for risk.
In summary, the current bull market…
- Has been shorter than recent bull market cycles.
- Has been stronger than recent bull market cycles.
- Doesn’t have to end because of positive returns the previous year.
- Lands somewhere between the first and second stage of Howard Marks’ investor sentiment description (see Sniffing All-Time Highs and Nobody is Happy).
Curious about what a potential correction looks like? You can check that out in “What’s in a Bear Market?”
Happy New Year!
