
“The biggest risk is always what no one sees coming, because if no one sees it coming, no one’s prepared for it; and if no ones’ prepared for it, its damage will be amplified when it arrives.” – Morgan Housel, Same as Ever: A Guide to What Never Changes
Let’s say I appeared on CNBC and said, “I believe the market is likely to rise over the next 30 years, but it won’t be a straight line. Some years stocks will go down. Every now and again things will rather get ugly. However, I would mostly expect stocks to go up.”
My comments would probably be met with blank stares.
Some may call me an aloof idiot, ignoring the daily news headlines that are fraught with risks.
Looking at market history, an objective observer might agree my comments are the most likely scenario, but it doesn’t sound sophisticated or informative. It can be tough to distinguish simplistic advice from incompetence.
In any given year, how often do stocks go up, down, or sideways?
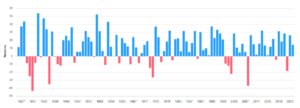
Looking at the S&P 500 calendar year returns from 1926 – 2023 (97 years of data), we observe…
- The S&P 500 return was positive in 65 years. 27 of those positive years the S&P was up >20+%
- The S&P 500 return was negative in 30 years. 7 of those negative years the S&P was down >20+%
- The S&P 500 was nearly flat two years (1947 & 2011).
Breaking down the S&P’s historical calendar returns, we can proclaim over the past 97 years…
- 67% of the time the S&P 500 went up. 27% of the time the S&P went up >20%+.
- 31% of the time the S&P 500 went down. 7% of the time the S&P went down by >20%.
- 2-3% of the time the S&P 500 was flat.
Note: past performance is not an indication of future results. We can use historical data to contextualize our current attitude towards the stock market and risk.
Source: Slickcharts.com
The above chart shows calendar year returns for the S&P 500 (1926 – 2023). Blue bars indicate positive return years. Red bars indicate negative return years.
It turns out, “some years stocks will go down. Every now and again things will rather get ugly. However, I would mostly expect stocks to go up,” isn’t that far off from how the market has ebbed and flowed over the past century. We can’t expect future returns to jive with the past, but we can use historical data to understand potential outcomes and “probable probabilities”.
When you think in probabilities, you’re less likely to get caught off guard or spooked by potential market decline.
- You’re less surprised by surprises (see “Surprised by Surprises“).
- You understand ~31% of the time the S&P 500 goes down. Occasionally, stocks really go down (>20%).
- You’re likely to avoid making predictions about the next week, month, or year.
- You won’t need to identify as optimistic or pessimistic on stock market prospects.
It’s been said a sound financial approach is, “save like a pessimist, invest like an optimist,” (source: Morgan Housel). I tend to agree.
If you have short-term liabilities (saving for a house, medical expenses, college tuition), you might hold cash to cover those obligations.
If you have long-term liabilities (funding a 30+ year retirement), growth assets i.e. stocks, real estate, etc. would be reasonable.
Thinking in probabilities better allows an investor to acknowledge changes in market conditions. Constant change has been the essence of financial markets throughout history. It’s also the hardest thing for most investors to accept.
Here’s an excerpt from the book “Richer, Wiser, Happier” by William Green:
“The economy expands and contracts; consumer spending waxes and wanes; corporate profitability rises and falls; the availability of credit eases and tightens; asset valuations soar and sink.”
The opposite assumption for an investor, and potentially the most reckless, is that current market conditions will stay the same. For example, the idea that “if markets are rising, they will keep rising”, can lead to excessive risk taking and overconfidence.
On the other side, “if markets are selling off, the pain will continue”. We’ve seen this bias lead to panic selling, indecision, or the inability to recognize how things could get better.
The optimal allocation is different for everyone. In my opinion, the best approach is an allocation that you can stick to through good & bad markets. Thinking in probabilities allows an investor to appreciate the range of potential outcomes and risks, get off the prediction carousel, and prepare for whatever could happen next.
Thinking in probabilities beats predicting.