“In real-time, every crisis feels like the worst thing ever. In hindsight, every crisis is an obvious buying opportunity.” – Morgan Housel, author
This isn’t very fun, now is it?
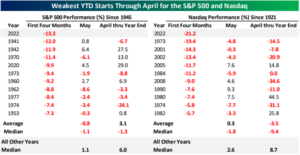
Through the first four months of the year…
The S&P 500 is off to its worst start since 1939.
The NASDAQ is off to its worst start ever.
Source: Bespoke Investment Group
The above graphic shows the weakest S&P 500 and NASDAQ performance through April (since 1945 for S&P, 1971 for NASDAQ). Performance in May and the rest of the year in the above graphic is all over the map for each index.
The ugly market action has nervous investors looking for any reason to abandon ship.
Could the “Sell in May and Go Away” narrative drive the market lower?
Let’s look at recent history.
Source: Bespoke Investment Group
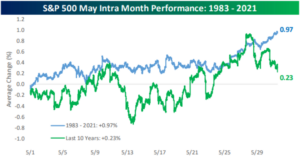
The above graph shows S&P 500 returns for May (1983-2021). May performance has been weaker the last ten years (green line). Looking at the entire period since 1983, May returns have been much stronger.
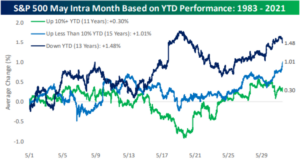
How does May hold up when year-to-date (YTD) returns are great, good, and negative?
Source: Bespoke Investment Group
The above graph shows returns for May (1983-2021) when YTD performance is +10%+ (green), up less than 10% (blue), and down YTD (dark blue). Recent history would suggest negative YTD performance could lead to positive May performance.
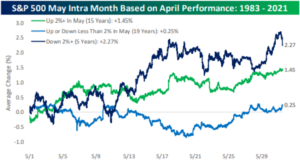
How does May hold up when April returns are great, good, and negative?
Source: Bespoke Investment Group
The above graph shows returns for May (1983-2021) when April performance is 2%+ (green), up/down less than 2% (blue), and down 2%+ (dark blue). Again, recent history would suggest rough April performance could lead to positive May performance.
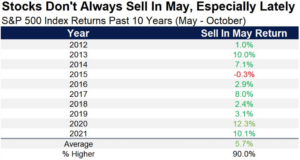
Finally, here’s a snapshot of S&P 500 returns from May-October (2011-2021).
Source: Ryan Detrick, Chief Market Strategist, LPL Financial
The above graphic shows S&P 500 returns from May-October over the last 10 years. The “Sell in May” strategy hasn’t worked out so well the last decade.
We cannot predict what happens next, but recent history would suggest…
- May has averaged a 0.97% return over the last 38 years (1983-2021)
- Poor YTD performance can lead to May outperformance
- Poor April performance can lead to May outperformance
- The last 10 years, the “Sell in May” period of May to October, has been favorable for investors.
Remember, selling is easy. The hard part is when to get reinvested, which most people get completely wrong. There is no “All-Clear” signal when it comes to investing.
For more on the origins of “Sell in May & Go Away,” see our post from 2018.
