“What you see is not what others see. We inhabit parallel worlds of perception, bounded by our interest and experience. What is obvious to some is invisible to others.” – George Monbiot, British writer
According to a Harris/Guardian poll, ~50% of Americans believe the S&P 500 is down for the year. In addition, 56% of the respondents think the U.S. economy is in a recession.
As of this writing (6/19/2024), the S&P 500 is up ~14%. The latest GDP report shows the economy is growing at an annualized rate of 1.3%.
How can there be such a disconnect between perception and reality?
- ~60% of Americans own stocks, which means 40% don’t own any.
- Media leads with fear & scary headlines. It’s been said the daily news is designed to make every problem, your problem (see Retirement Propaganda War).
- People associate politics with everything. 50% of Americans will be miserable if their preferred party is not in power.
- There is a financial literacy crisis in the U.S.
- There seems to be a different economic reality for those that own financial assets and those that do not.
In my opinion, all the above have merit.
It’s tough to follow stocks if you don’t own any. Media knows people love a good trainwreck. There is a major knowledge gap when it comes to money and investing. Political polarization is more prevalent than ever. Inequality continues to be a problem.
I think there could be another reason for the disconnect…
Depending on how you’re invested, the experience could be vastly different.
If you own anything related to AI, U.S. technology, or the S&P 500, you’re feeling pretty good.
If you own anything else, you’re wondering what the heck is going on.
2024 is the tale of two markets.
In the below post, we highlight some of the extreme historical deviations between U.S. large caps and other asset classes.
Index Gap
 Source: Koyfin (as of 6/18/2024)
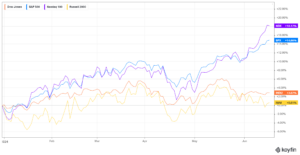
The above chart shows year to date performance for the Nasdaq (purple), S&P 500 (blue), Dow Jones Industrial Average (orange), and Russell 2000 (small cap, yellow). Over history, these popular indices tend to track quite closely. In 2024, there is a wide divergence between the S&P 500 and the Dow Jones. Depending on which benchmark you prefer, it could lead to a major difference in how someone perceives their investments.
Sector Gap
Source: Bespoke Investment Group (as of 6/14/2024)
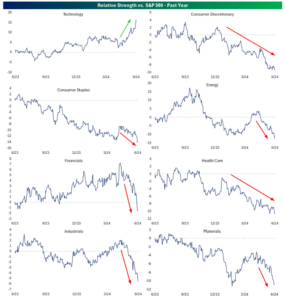
The above chart shows sector relative strength vs. the S&P 500 over the past year. Most every major sector is trading down relative to technology. It’s not a surprise that an investor making sector bets outside of technology has a much different perception on market conditions.
Size Gap
Source: Bespoke Investment Group
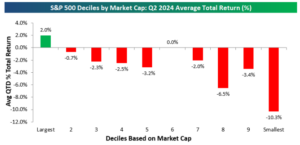
The above chart shows second quarter performance for S&P 500 stocks by company size. Moving from left to right, the largest companies have performed the best in the second quarter, while smaller company performance has been dismal (far right).
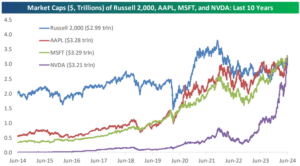
Zooming out and looking at the last 10 years, we can see how the biggest companies keep getting bigger…
Source: Bespoke Investment Group
The above graph shows Apple (APPL, red), Microsoft (MSFT, green), and NVDA (Nvidia, purple). Each of these tech behemoths are bigger than the entire value of every company within the Russell 2000 index. For example, Apple (by itself), is bigger than all ~2,000 companies within the U.S. small cap universe. Crazy!
Style Gap
Source: Creative Planning, Charlie Bilello
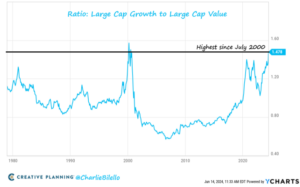
The above chart shows the ratio of U.S. Large Cap Growth to Large Cap Value. When the blue line is trending higher, growth stocks are in favor. When the blue line is trending lower, value stocks are in favor. As technology stocks have propelled higher, the growth vs. value ratio is approaching levels last seen in 1999 -2000, which preceded the technology bubble bursting (we aren’t claiming the euphoria around tech is the same this time around, rather the Growth vs. Value gap is worth noting).
Country Gap
Source: Creative Planning, Charlie Bilello
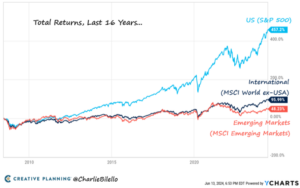
The above chart shows total returns for U.S. stocks (S&P 500, blue), International (MSCI ex-US, dark blue), and Emerging Markets (MSCI EM, orange). The last 16 years it has paid to be a U.S. centric investor. Do U.S. stocks deserve a valuation premium vs. the rest of the world? Could the next 16 years provide a favorable set up for foreign stocks?
Technology stocks have helped propel the S&P 500 higher over the past decade plus. Artificial Intelligence stocks have poured gasoline on the fire.
If you have exposure to tech, AI, or the S&P 500, you’re likely riding high.
If you own virtually anything else, you might have a less favorable perception of the stock market.
Could some of the historical dislocations i.e. growth vs. value, large companies vs. small, U.S. vs. foreign stocks, smooth themselves out over the next phase of the cycle?
