
“A decade ago, I made a goal to read more history and fewer forecasts. It was one of the most enlightening changes of my life.” – Morgan Housel, Same as Ever
Every year we get the same charade; smart sounding people that pretend to know what will happen next in financial markets. There’s nothing wrong with that if you understand the whole prediction complex is a play on human psychology. You see, us humans crave certainty. We find comfort that someone out there can predict the future (even if it ends up being BS).
The trouble is prediction or narrative investing doesn’t work. Narrative investing makes for a good story but is often quickly forgotten as the market moves on. Recent narratives include “trade war will cause a global recession, Middle East conflict is the start of WWIII, etc.”
These narratives dominated global headlines, but quickly turned into an afterthought as the next important inflation release, earnings report, or jobs number hit the newswire.
Not only is narrative investing exhausting, but it can distract from what truly matters to financial markets (see “Turn off the TV”).
I’ve found a better approach is using history to frame potential outcomes, which we can assign rough probabilities, which could help the humble investor make better decisions (see “Probable Probabilities”).
As Mark Twain said, “history doesn’t repeat, but it often rhymes.”
We outline several historical data points around intra-year drawdown (how much the market sells off in any given year), frequency of positive & negative returns, asset class trends, and historical average returns (which are seldom average).
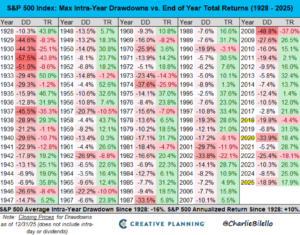
Source: Creative Planning, Charlie Bilello
The above chart shows intra-year drawdowns (DD, left column) and total returns (TR, right column) for every calendar year since 1928. It is perfectly normal for the stock market to experience sharp drops during the year. Since 1990, 21 out of 36 calendar years have experienced a decline of 10% or worse. Market drops aren’t some anomaly or a sign of impending doom, rather the cost of admission for achieving returns above the risk-free rate.
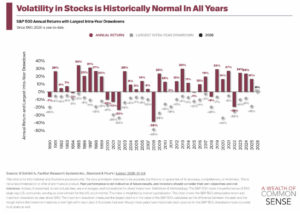
Source: A Wealth of Common Sense Blog, Ben Carlson
The above graph shows intra-year drawdowns (gray diamonds) and how the year finished (maroon bars). Just because the market takes a dive doesn’t mean it will finish the year in the red. Of those 21 years with big drops since 1990, 14 of them finished the year with a positive return.
The market has a remarkable ability to turn volatility into gains. Out of the 14 “comeback” years mentioned above, 11 of them finished with double-digit gains, including a massive comeback in 2025.
During the spring sell-off of 2025, we wrote “The Closest Thing to a Fat Pitch in Investing,”…
“It’s grossly understated how bad humans are at forecasting. We can gain an advantage over investors that lean too heavily into hubris and prediction by studying history.
In our opinion, the closest thing to a “fat pitch” in investing is putting capital to work in a crisis market environment. Putting cash to work when it feels like you want to puke can be a pretty good investment strategy.”
What followed was one of the biggest intra-year rallies for the S&P 500 in history.
The market doesn’t always bounce back immediately. In years like 2008 and 2022, the market dropped and stayed down for the year. This is the difficult part of investing; sometimes the recovery takes a little longer.
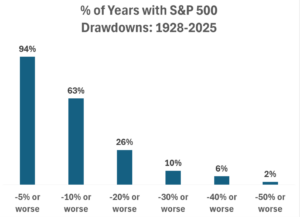
Source: Ben Carlson
The above chart shows the percentage of time we get minimal, modest, or painful drawdowns (S&P 500, 1928 – 2025). While massive losses can occur, we find that doomsdayers often cost themselves (and their followers) more by perpetually predicting “black swan losses.” We can avoid emotional decisions by knowing what we are getting into as equity investors. In other words, losses of 10% or worse occur 63% of all years.
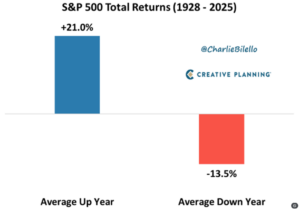
Source: Creative Planning, Charlie Bilello
The above graphic shows the average S&P 500 “up year” (blue) vs. the average “down year” (red). U.S. markets historically have a positive skew, meaning the good results are better than the bad results.
We can drill down to the asset class level to capture the persistence of outperformance…
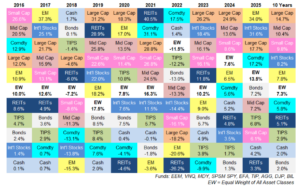
Source: Ben Carlson
The above quilt shows which asset classes performed the best since 2016 (best performers at the top). Since 2016, U.S. Large caps have been a dominant force, leading the charge vs. every other equity asset class. Most investor allocations are heavily overallocated to U.S. Large cap and big technology companies because it’s worked. History has shown leaders often become laggards and vice versa. In our opinion, an investor would do well to diversify beyond the S&P 500 (see “Investors are Making a Massive Bet (and don’t know it)”.
While the S&P’s long-term annualized returns are around 9%, actual returns are rarely “average”…
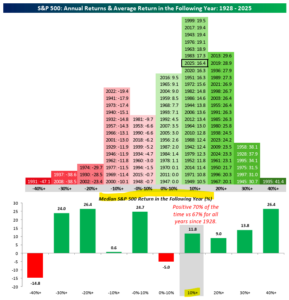
Source: Bespoke Investment Group
The above graph shows the frequency of returns for the S&P 500 for every calendar year since 1928. When the S&P 500 is positive it tends to be very positive, note the most frequent return distribution is 10-20+%. At the bottom of the graph, we show the following year’s return based on the previous year’s performance. Following a year of 10+% returns, the following year averages 11.8% and positive 70% of the time (not a promise of future performance).
How can leaning into history and avoiding narrative investing help us?
- Volatility and gains can happen together. Roughly 40% of all years since 1990 that suffered a double-digit crash still managed to finish the year up by 10% or more. The market can produce both pain and profit in the same calendar year.
- Patience & pain is the price of admission. You must be willing to survive short-term volatility to earn long-term rewards. If you sell during the scary times, you often miss the ride higher.
- Diversification still matters. While U.S. large-cap stocks have been dominant recently, in our opinion, other equity asset classes have a superior risk/return profile going forward.
If you or your advisor are prone to making “gut calls”, predictions, or you need help with risk management, shoot us a note at insight@pureportfolios.com or click here.