“There is no such thing as a riskless hedge against inflation.” – Edgar Fiedler, economist and former U.S. Assistant Secretary of the Treasury for Economic Policy
It’s January 2022 and I’m nervous about the market. I’m looking to rotate my portfolio into defensive assets that have historically held up well during equity market selloffs.
After doing some research, I land on the following portfolio allocation (ETF ticker symbols) …
Gold (SGOL)
Short-Term U.S. Treasuries (SCHO)
Consumer Staples stocks (IYK)
Utilities stocks (IDU)
Intermediate U.S. Treasuries (SCHR)
Long-term U.S. Treasuries (TLT)
For simplicity, let’s assume my portfolio is $1,000,000 and equally weighted in the above asset classes ($166,66 or ~16.66% in each position).
Comfortable with my new defensive portfolio, I go on holiday in the Alaskan bush until October 2023. I have zero cell service, internet, or contact with the outside world.
It’s October 2023 and I’m back on the grid. It turns out my gloomy market prediction was spot on. I can’t wait to see how much money I made by going defensive at the perfect time.
My jaw drops to the floor…
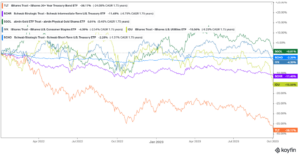
Source: Koyfin
The above graph shows the total return for my “defensive” portfolio from 01/03/2022 to 10/3/2023.
Despite timing my portfolio rotation perfectly, I’ve managed to lose ~$118,500 (~12% loss).
Surely, my portfolio has held up relative to the broader stock indices.
Not so much…
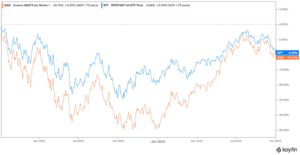
Source: Koyfin
The above graph shows the total return for the S&P 500 (blue) and Nasdaq (orange) for the same period of 01/03/2022 to 10/3/2023.
How could 100% equities, many of which are technology stocks, outperform a defensive portfolio?
It’s complicated, weird, and unprecedented in recent history.
Ideally, we want to own assets that move differently during periods of market stress. For example, if stocks go down, bonds go up.
How two assets move in relation to one another is known as correlation. A ‘1’ would represent a perfect correlation, meaning the assets move perfectly up and down together. A ‘-1’ would represent a perfect negative correlation, meaning the assets move in the opposite direction. A correlation of ‘0’ would represent a random or no correlation.
Here are several asset class correlations from 2021. Let’s focus on the relationship between U.S. Large Cap stocks (IVV) and several bond ETFs (highlighted below)…
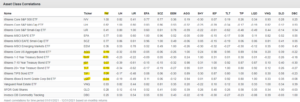
Source: Portfolio Visualizer
The above matrix shows how various assets move in relation to one another for the calendar year 2021. We can match up U.S. Large Cap stocks (IVV) and see how they move in relation to various bond ETFs (highlighted in yellow). We are looking for negative or low correlation between stocks and bonds (either low or negative numbers on the matrix). In 2021, that’s exactly what we got; when stocks were down or up, bonds wouldn’t really track their movement. That’s diversification working.
Across the board in 2021, the above highlighted bond ETFs show either little or no correlation to equities. That’s a good thing.
Let’s look at the current market environment (January 2022 – October 2023). Again, let’s focus on the relationship between U.S. Large Cap stocks (IVV) and bond ETFs (highlighted below) …
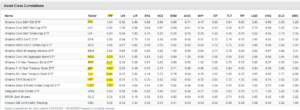
Source: Portfolio Visualizer
The above matrix shows how various assets move in relation to one another from January 2022 to October 2023. You’ll notice the correlation numbers are much closer to 1. In other words, almost every asset class is moving together. During this period, when stocks go down, bonds are selling off too.
This is what people mean when they say, “there’s nowhere to hide in this market.”
Diversification breaks down when an investor owns 10 different asset classes and they all move together.
Even more challenging, the places investors used to hide; U.S. Treasury bonds, consumer staples, and utilities aren’t working.
What’s the 2023 version of a defensive asset?
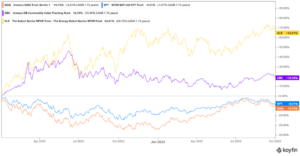
It would seem energy & a diversified basket of commodities fits the bill…
Source: Koyfin
The above graph shows the S&P 500’s Energy sector ETF (yellow) and a Commodity ETF (DBC). Energy stocks and commodities have been a good place to hide this cycle. Ironically, no one wanted any part of these assets before the pandemic.
In my opinion, the above examples are what makes this current market so perplexing. The traditional safe havens have been hit harder (or just as hard) as riskier corners of the market.
It seems unexpected higher inflation and the most aggressive Fed interest rate hiking campaign are bad for most all asset classes.
Here are some other thoughts…
- Asset class correlations, how two assets move in relation to each other, can change over time.
- Going from record low rates to the highest interest rate regime in decades can cause unintended consequences.
- Unexpected inflation has caused havoc in financial markets (the market really hates inflation).
- Occasionally, markets do not make sense.
- As inflation stabilizes and the Fed’s next action is transparent, we could see a return to “normal” asset class correlations (diversification working again).
- Higher bonds yields could be a precursor for better future bond returns.
- What’s safe can be risky, and what’s risky can be safe.
Have questions or feedback? Send us a note at insight@pureportfolios.com
