“Majority opinion can give any market movement considerable momentum that keeps it going in the same direction. Majority opinion is inevitably and consistently wrong at turning points.” – Peter Bernstein, famous investor
I don’t pay attention to 99% of market commentary.
People can say whatever they want with zero consequences for being wrong.
You end up with a broken dam of useless information, biased narratives, and cluttered noise.
I intentionally keep a tight information filter.
In my opinion, keeping a tight filter is the most underrated skill for the modern investor (it works in other areas of life too… try turning off local and/or national news).
I do pay attention to what the markets are saying.
From our July 29th, 2021 post, “Taking Cues from the Market,”…
“Investors end up getting sucked in to the noise while missing the important signals the market is giving. I want to know how are investors voting with their capital.”
It’s often said financial markets are the best forecasters.
So, which asset class has it right?
We look at the major asset classes and attempt to understand what they’re telling us.
Our observations are based on recent price movements.
Equities
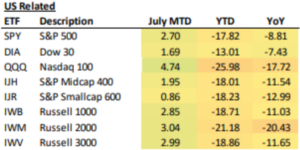
2022 has been a challenging year for global equities. Things have been a bit better for U.S. stocks in July (as of 7/13/22).
Source: Bespoke Investment Group
The above graphic shows U.S. equity returns across popular indices in July, year-to-date, and last 12 months (YoY). In July, we’re seeing a bit of a comeback for some of the worst performing sectors, notably tech & small cap.
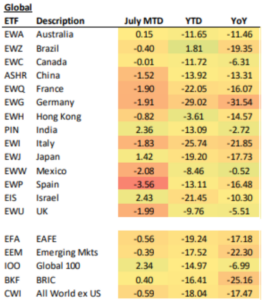
Global stocks haven’t held up much better (there have been a few exceptions, the commodity-heavy economy of Brazil for example).
Source: Bespoke Investment Group
The above graphic shows equity returns across country ETFs & global indices in July, year-to-date, and last 12 months (YoY). July hasn’t been as kind to global markets with European countries hit particularly hard.
Fixed Income
Bond investors endured a perfect storm of starting from historically low yields, inflation, and rising interest rates. The result was the worst first half performance in decades.
With recessionary winds starting to blow, the historical safe haven has attracted renewed interest from investors.
Source: GuruFocus.com
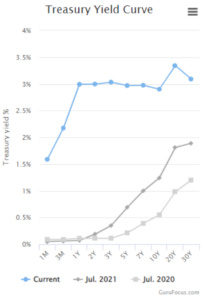
The above chart shows the yield curve journey from July 2020 (light gray) to current (blue). The short end of the curve closely reflects the Fed’s interest rate hikes. The longer end of the curve is trying to make sense of inflation and economic growth (that’s why it’s a jumbled mess).
Source: GuruFocus.com
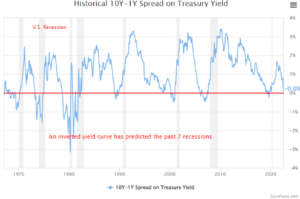
The above graph shows the historical spread for the 10-year Treasury minus 1-year Treasury yield. A negative number, also referred to as a yield curve inversion, is a signal often used to predict recessions. As of this writing, the 10-year – 1-year spread is ever-so-slightly inverted.
However…
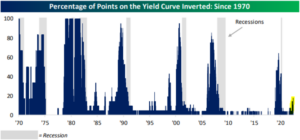
Source: Bespoke Investment Group
The above graph shows the percentage of points on the yield curve that are inverted. In simple terms, the more areas of the curve that are inverted, the higher likelihood of a recession. Today, the yield curve is not signaling that a recession is imminent (this could change quickly).
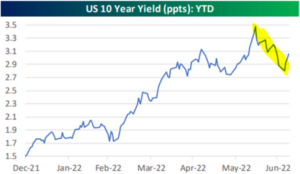
Source: Bespoke Investment Group
The above graph shows the 10-year U.S. Treasury yield December 2021 to July 10th. Historically, large drops in the 10-year yield signal a flight to safety.
Commodities
After a decade-plus of underperformance, commodities have had their day in the sun in 2022.
Until recently…
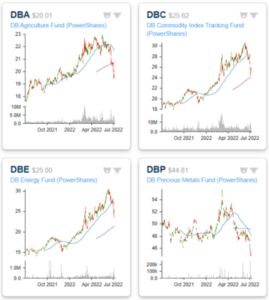
Source: Bespoke Investment Group
The above graphs show the price action of several commodity ETFs (agriculture, broad commodity index, energy, and precious metals). Supply shortages and transportation backlogs caused a broad-based rally in commodities. Waning demand and falling prices could signal a slowdown in economic growth.
Currency
King Dollar has been dominant in 2022. Historically, that hasn’t necessarily been a good thing.
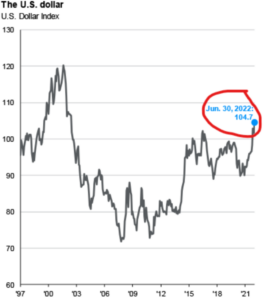
Source: J.P. Morgan Private Bank
The above chart shows the U.S Dollar index vs. a basket of global developed currencies. The U.S. Dollar is still the preferred global reserve currency. When the stuff hits the fan, market participants want to own U.S. Dollars.
What does it all mean?
Here’s our best interpretation of decoding what the markets are telling us…
• U.S. stocks have behaved better in July, but I put less weight on short-term movements in equity markets. In general, equity markets are more emotional and less rational than other asset classes.
• The U.S. yield curve is flashing yellow, but isn’t pricing in a recession just yet. A large drop in long-term yields or a large percentage of the curve inverting would be a major red flag.
• Commodities have fallen, which isn’t a good sign, but prices are heavily impacted by China’s COVID zero policy. Open for business one week and completely shut down the next has caused havoc in commodity markets (and other markets too).
• King Dollar’s ascension has much to do with the risk-off temperament of investors. Japan and the European Union have also fueled the Dollar’s rally with their stubbornly easy monetary policy.
Smart sounding narratives might be alluring, but we prefer to take our cues from the market.
