We shared a laugh about how easy it was to come up with a list of potential landmines for the financial markets. The conversation was centered around the heap of things that could go wrong. After a brief pause in the conversation, our new client leaned in and asked a simple, but brilliant question:
“What’s the optimistic case for U.S. stocks?”
I was impressed and caught off-guard at the same time. The client was simply inverting our position to understand the other side. Said differently, what are we missing?
I responded with some rambling nonsense about how we’re in the era of maximizing shareholder wealth, and that there is no alternative to stocks (TINA) to generate a meaningful return.
I quickly scribbled a note on my pad to think about his question more critically. What is the bullish case for stocks? Investors often obsess about what can go wrong (we love a good dumpster fire), but rarely see what can go right.
I needed something more and went out searching for off the beaten path data points to build an optimistic case…
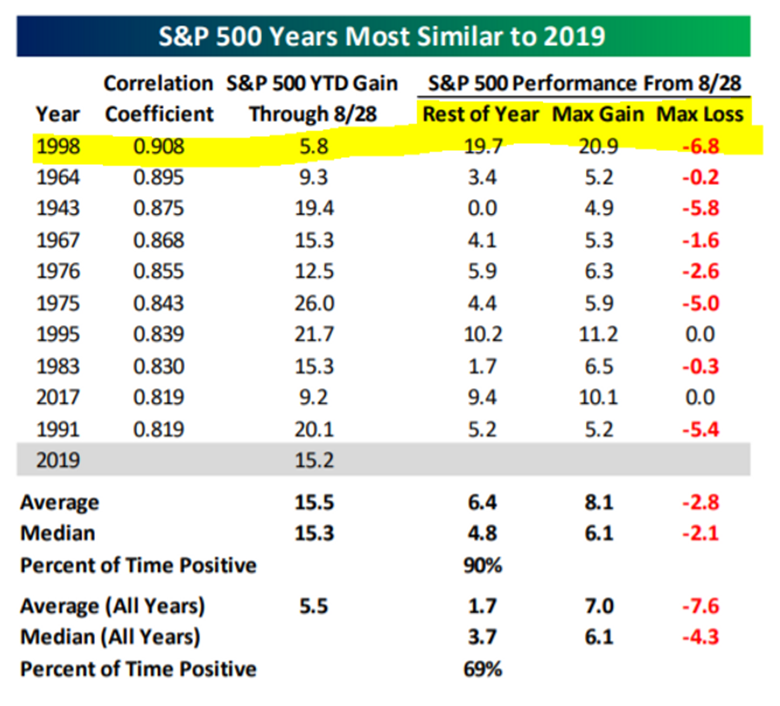
Market Paths Most Similar to 2019
Source: Bespoke Investment Group
The above graphic shows S&P 500 return years most similar to 2019. 1998 was the best fit through 8/28, the rest of the year turned out nicely with a return of ~20%. The other “best fit” years also did quite well with an average return of 6.4% for the remainder of the year (September to December). Note: this doesn’t mean 2019 is going to finish in a similar fashion.
Seasonality
Source: Bespoke Investment Group
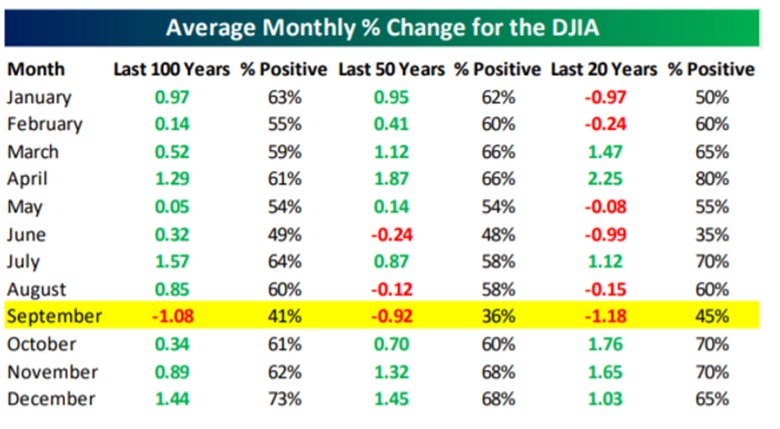
The above graphic shows the monthly percentage change for the Dow Jones for the past 100, 50, and 20 years. September has historically been the worst month for equity returns, while October, November and December have been the strongest, especially the past 20 years.
Source: Bespoke Investment Group
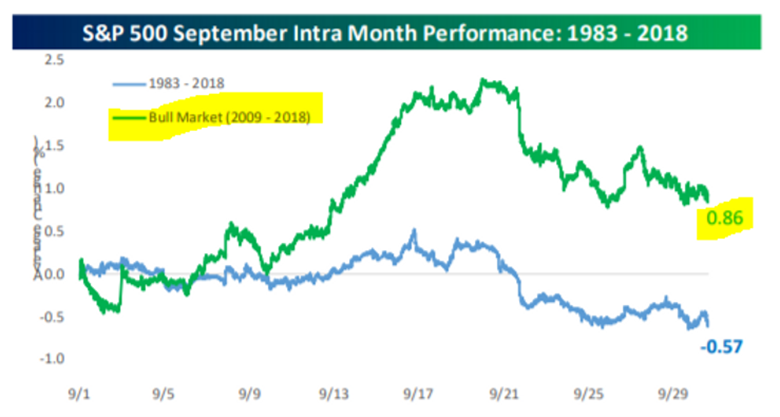
While September has been the worst performing month, recent history (2009-2018, green line) has told a brighter story, with an average return of 0.86%. Could September keep its positive streak alive in 2019?
Investor Sentiment
Source: Bespoke Investment Group
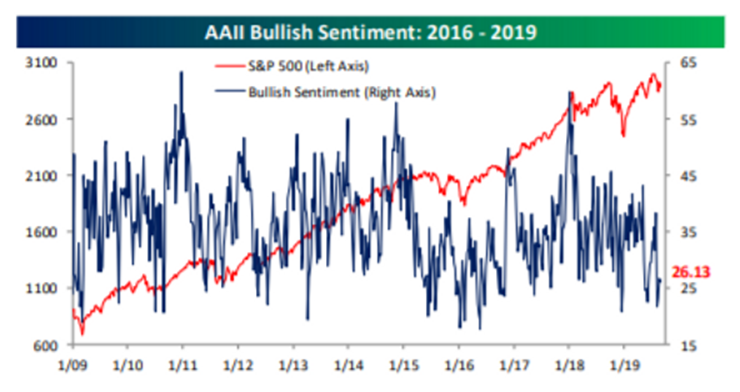
The above graphic shows bullish investor sentiment (blue line) with the S&P 500 (red line) in the background. Perhaps the most compelling case for an upward movement in stocks is that investor optimism has fallen off a cliff?
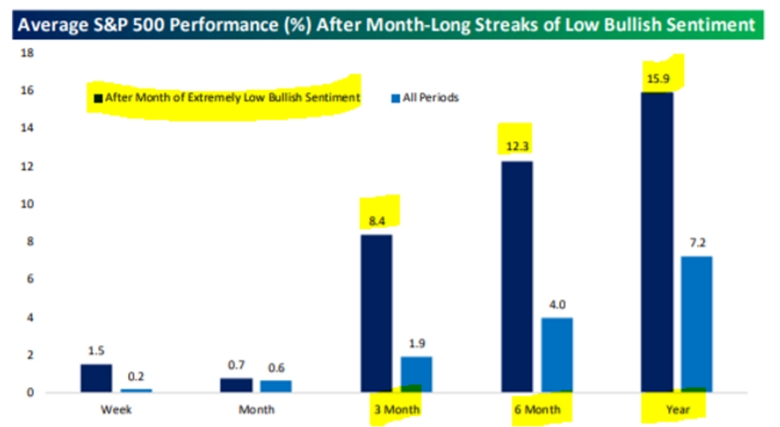
Source: Bespoke Investment Group
The above graph shows S&P 500 returns for periods after low bullish sentiment. Notice the outsized returns for 3 mo, 6 mo, and one-year time periods. Listening to your Uncle Elroy rail on about the pending stock market collapse could be music to your ears!
The simple question, “What’s the optimistic case for U.S. stocks?”, led me down a wonderful thought exercise.
Here’s what I learned:
- In today’s environment, building a pessimistic (bearish) case for future equity returns is much easier than an optimistic (bullish) case.
- If you have a strong conviction on a trade or asset class, ask “what could I be missing?” or “how could I be wrong?”
- It might not happen immediately, but there’s a penalty for being extremely bearish or leaning more aggressively than your risk profile.
- People love a good dumpster fire. There is less intrigue for what could go right.
When investor sentiment is in the dumps, that could be the most optimistic signal of all.
Share your questions and feedback on Twitter @pureportfolios or insight@pureportfolios.com
