
“History doesn’t repeat itself, but it often rhymes.” – Mark Twain
I post my blog every week on LinkedIn.
Last week, I wrote about what the major asset classes are telling us.
The premise was that investors should stop listening to random people on the internet and take their cues from the market.
One of my LinkedIn connections made the following comment…
“Smart approach! Drown out the fear, uncertainty, and doubt by limiting media noise. When will we see a stock market bottom?”
I felt like a proud Dad upon reading the first part of his comment. The second part, however, highlighted a trap in which many investors often fall into… trying to call the market bottom.
It’s impossible to time a bottom. No one can do it, but that doesn’t stop people from trying.
We touched on the length and severity for every bear market post WWII in “Bear Market Blues, How Much Worse Can it Get?”
This week, we examine metrics that historically have coincided with a market bottom.
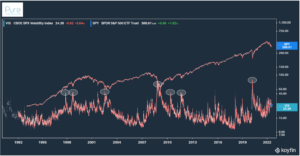
VIX – CBOE S&P 500 Volatility Index
The VIX is a measure of volatility for the S&P 500 (also referred to as the uncertainty index). The higher the VIX, the greater expected volatility for stock prices.
Since the VIX was created in 1993, it’s been a closely followed metric to measure fear in the market.
Historically, cycle peaks in the VIX have been consistent with market bottoms.
Source: Koyfin, Pure Portfolios
The above graph shows the VIX (bottom line) and the S&P 500 (SPY) since 1993. The white circles highlight cycle highs for the VIX. More of than not, peaks in the VIX are consistent with market bottoms. Current VIX levels (far right), aren’t signaling the bottom is in.
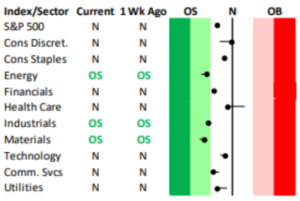
Overbought vs Oversold Stocks
Deep oversold readings (green zones) can be a contrarian indicator that stocks are due for a bounce. This doesn’t necessarily signal a bottom, but can give traders insight when conditions are out of whack.
Source: Bespoke Investment Group
The above chart shows S&P sector oversold & overbought conditions (as of July 19th, 2022). When the black dots enter the green zone, it indicates stocks for that sector have been oversold and could be due for a short-term bounce.
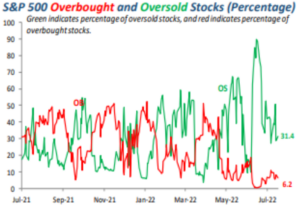
Here is a similar overbought & oversold reading at the individual stock level…
Source: Bespoke Investment Group
The above chart shows components of the S&P 500 trading one standard deviation above or below their 50-day moving average. In simple terms, when the green line is high and the red line is low, the S&P is extremely oversold.
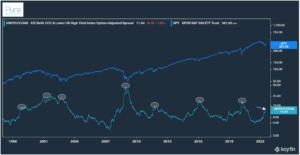
High Yield Credit Spreads
Credit spreads measure the cost of corporate borrowing over a risk-free rate (like a U.S. Treasury). Elevated credit spreads could signal economic stress, while tight credit spreads could indicate an appetite for risk-taking.
Historically, peak credit spreads have signaled a market bottom.
Source: Koyfin, Pure Portfolios
The above graph shows the S&P 500 (blue line) and the CCC-rated high-yield bond spread (junk bonds, teal line). The white circles highlight peak credit spreads for each cycle since 1998. Investing (or increasing equity allocation) when high-yield spreads peak has been a lucrative strategy.
Investor Sentiment
We’ve covered investor sentiment extensively. When investors feel the worst, future returns are the best.
Unfortunately, people often do the opposite of what they should do: sell when things get tough, take more risk when things seem easy.
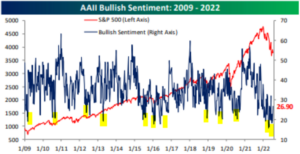
Source: Bespoke Investment Group
The above graph shows the S&P 500 (red line) and AAII Bullish Sentiment (blue line, 2009-2022). The yellow highlights signal a lack of enthusiasm for equities. In most instances, the S&P raced higher after sentiment reached cycle lows.
The overarching theme is many of the bottoming indicators are contrarian. For example, peak volatility could be a good sign. Beaten down investor sentiment can signal things might get better.
To be clear, we don’t condone trying to bottom-tick the market. In our opinion, more money is lost by investors trying to predict inflection points in the market (large changes in direction).
Most would be better off focusing on mitigating damage rather than playing the market oracle.
Want to learn more about allocating cash in a bear market?
Check out our video, “Investing Cash in a Bear Market.”