“We deceive ourselves when we believe that past stock market return patterns provide the bounds by which we can predict the future.” – John Bogle, Vanguard founder
Each year, Wall Street banks and money managers outline long-term return expectations for every major asset class.
The definition of “long-term” is in the eye of the beholder.
When I first got started managing money in 2004, long-term meant 10+ years.
In the digital age, when time is scarce, and our attention spans are short, long-term might mean 2-3 years.
The estimates are based on fundamentals, current valuation, demographics, economic/political stability, etc.
I don’t put much stock into the individual estimates of any one firm. However, I noticed something odd with the 2024 projections.
Most every professional investor is predicting the same thing over the next decade.
U.S. stocks will perform less well.
Bonds will perform better.
International & Emerging stocks will be the best performing equity asset classes.
This flies in the face of what most investors are saying and doing (see “Why Not Go All-in on the S&P 500?“).
Who’s right? Nobody knows. While there is evidence to suggest bond returns track closely to current yields (see “Starting Yield and Future Bond Returns“), trying to predict equity returns over any time period is fleeting.
Here are long-term equity return expectations from several firms…
*Note: some of the firms use before inflation (nominal), while others use after inflation (real). The time horizons also vary among firms. Details aside, we are attempting to capture the consensus return expectations across investment firms.
Blackrock
*10-year expected nominal (before inflation) annualized returns
- 2% U.S. Large Cap
- 9.9% International Developed equities
- 9.11% Emerging Market equities
- 5% U.S. aggregate bonds
Fidelity
*20-year expected real (after inflation) annualized returns
- 3.9% U.S. Large Cap
- 3.9% International Developed equities
- 5.4% Emerging Market equities
- 2.1% U.S. aggregate bonds
GMO
*7-year expected real (after inflation) annualized returns
- -2.6% U.S. Large Caps (you read that right, negative annualized returns!)
- 2.3% international developed equities
- 4.7% emerging market equities
- 1.9% U.S. aggregate bonds
Vanguard
*10-year expected nominal (before inflation) annualized returns
- 4.2% – 6.2% U.S. Large Cap
- 7% – 9% International Developed/Emerging Market equities
- 4.8% – 5.8% U.S. aggregate bonds
Source: Morningstar
Many of the above projections cite stretched U.S. large cap valuations as the primary driver for lower future returns.
The thinking goes something like this…
Higher valuation today, lower future returns tomorrow (the opposite would be lower valuation today, higher future returns tomorrow).
That makes sense in theory, but U.S. stocks have had other ideas.

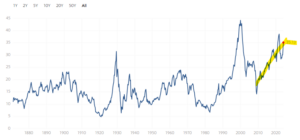
Source: Multpl.com
The above graph shows the CAPE P/E ratio for U.S. stocks over the past 100+ years. The CAPE ratio is a valuation tool that takes the average corporate earnings over the past 10 years. In general, the higher the CAPE ratio, the more expensive the underlying index. You can see the CAPE ratio (and U.S. stocks) keep going up and getting more expensive. As we’ve said before, valuation is a valid metric, but a lousy timing tool.
Are U.S. stocks due for a period of lower future returns or can they keep ascending despite elevated valuations?
I don’t know. Furthermore, the estimates from the above money managers are likely to be wrong, it’s a matter of how wrong.
There are a few interesting nuggets from the exercise…
- Professional investors are singing a different tune compared to the retail investor. Pros are projecting lower returns for U.S. large cap. The average investor is trying to shovel every dime into the S&P 500.
- Many investors have much higher return expectations than professional investors.
- Investors tend to overweight what just happened. If an asset class has had a great run recently, we tend to think the good times will keep rolling (see “The Why in Diversify“).
- Valuation is a terrible timing tool. What’s overvalued can stay overvalued for a long time. What’s undervalued can stay undervalued for a long time.
- Avoid the extremes. The allocation decision isn’t 100% S&P 500 or 100% money market. Build a portfolio that reflects the way you feel about risk. Stick to it when times get tough.
For more on Pure Portfolios’ investment approach for retirees, click here.
