“All past market declines look like opportunities, all future market declines look like risks.” – Morgan Housel, author and investor
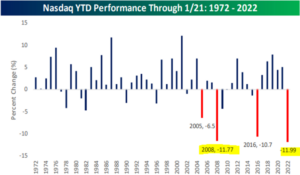
Watching the stock market tank is never fun. The NASDAQ saw its worst start to any year since the index formation in 1972.
Source: Bespoke Investment Group
The above graph shows the worst drawdowns for the NASDAQ every year since inception (1972). As of 1/21/22, the popular index is off to the worst start ever!
Yikes!
It’s not all bad.
Here’s our observations on the market action and investor behavior…
The Law of Large Numbers
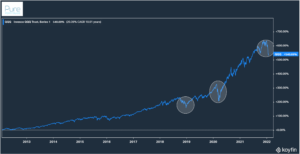
The NASDAQ has been a runaway freight train the last decade…
Source: Koyfin, Pure Portfolios
The above chart shows the NASDAQ over the past decade. There’s been a few bouts of steep drawdowns for investors (white circles), but for the most part it’s been very lucrative. Over the last 10 years, the NASDAQ posted an annualized return of 20.39%. An investor would have 5x their money from 2012 to Jan. 2022.
Can it continue?
We like technology stocks and own several in Pure models (and personally).
However…
Investors blindly shoveling money into Google, Apple, Facebook (Meta), Amazon, Netflix, etc. might want to reset their return expectations.
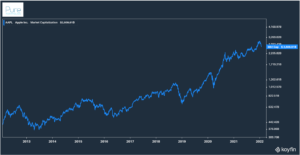
Take Apple for example…
Source: Koyfin, Pure Portfolios
The above graph shows Apple’s market cap over the past 10 years. Market cap is a metric to measure the size of a company. We multiply price per share x number of shares outstanding.
It’s really hard to go from a $300 billion market cap to $2.7 trillion, but that’s exactly what Apple has done over the last decade. It’s unheard of to go from $2.7 trillion to $8 trillion.
Apple and other big technology companies are running into the law of large numbers.
The bigger they become, the harder it is to grow.
Action Item: That doesn’t mean one cannot enjoy positive returns in big tech, but it might be prudent to temper future return expectations or rebalance outsized positions.
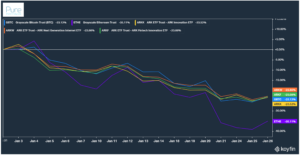
Pain Has Been Concentrated in the Most Frothy Areas
Source: Koyfin, Pure Portfolios
The above graph shows Grayscale’s Bitcoin Trust (blue), Grayscales’ Ethereum Trust (purple), and a handful of ARK ETF funds.
If you’re investing in digital assets or emerging technology companies, the range of outcomes is going to be all over the place. There’s a faction of investors that are learning an expensive lesson.
We recently met with a prospective client that was frustrated with their portfolio. They couldn’t understand why they were losing money. The portfolio was invested in the riskiest corners of the market, i.e. emerging tech stocks, EV carmakers, biotech, etc.
There was no stable, core portfolio. It was a jumbled collection of the hottest and best performing names of yesterday. Unfortunately, performance chasing seldom works.
What goes up the fastest, often falls the hardest.
Action item: Double check your risk exposures. Understand previous drawdowns for each asset that you own. Jot down your reasons for buying a stock, ETF, or asset. Revisit periodically to see if it still fits with your original thesis and financial situation.
What’s Unloved Can Become Loved
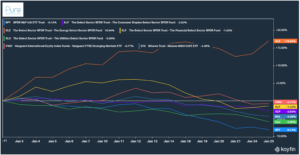
The selloff hasn’t been uniform across the board. There have been pockets of resilience, both at the sector and asset class level.
Source: Koyfin, Pure Portfolios
The above graph shows various sector and equity asset class performance year-to-date (YTD as of 1/25). For absolute return, the energy sector (orange) is the pack leader +17%. On a relative basis, Emerging Markets (red), Financials (yellow), Consumer Staples (purple), and International Developed (blue) are holding up nicely.
The energy sector has been beaten down for the better part of a decade. Lo and behold, it came back with a vengeance in 2021 and 2022.
Markets move in cycles. No sector or asset class enjoys endless gains without pain. No sector or asset class enjoys endless pain without a moment in the sun.
Find a balance that fits your situation.
Action item: You can love a particular stock, industry, sector, etc., but set a limit on position size (for example, max size is 10% of investable assets). It’s easy to become emotionally invested in seeing a position do well, which can cloud future decision making.
Investor Attitudes Can Change Overnight
When people ask what the market does next, they’re really asking how human appetites for risk are going to change in the future.
When you frame it like that, the “what does your crystal ball say” questions seem ridiculous.
Build a portfolio with both sides of the market cycle in mind. There’s no such thing as uninterrupted gains without incurring the pain of loss.
Action item: If you find yourself getting worked up over losses, tracking every ebb and flow of the market, or feel compelled to make a major allocation change, you may be invested incorrectly. Reassess your risk tolerance and acceptable range of investment outcomes. We use Riskalyze to map each client’s risk tolerance to the appropriate portfolio.
The Biggest Error
We talk more than most advisors about behavioral gaps, blind spots, cognitive & emotional biases. Every irrational investment decision stems from one overarching error…
Trying to avoid losses.
Losses are part of investing. Embrace it. Accept it. It’s the cost of admission. A right of passage.
We can’t enjoy the greatest wealth creation engine of all-time without the occasional pain of loss.
Action item: If you can’t get out of your own way, hire a professional, credentialed advisor. If you work with an advisor, find out how they manage risk when things get difficult. Understand if the market tanks, we will all feel pain. Rather than play the market oracle, focus on mitigating damage (see “Mitigating Damage without Placing a Trade“).
For further reading about Pure Portfolios risk management process, check out…
“Why Trend Following Could Make Sense for Retirees”
