The cycle ended with hardly a peep, but it looks like the Fed is done increasing rates.

Source: YCharts
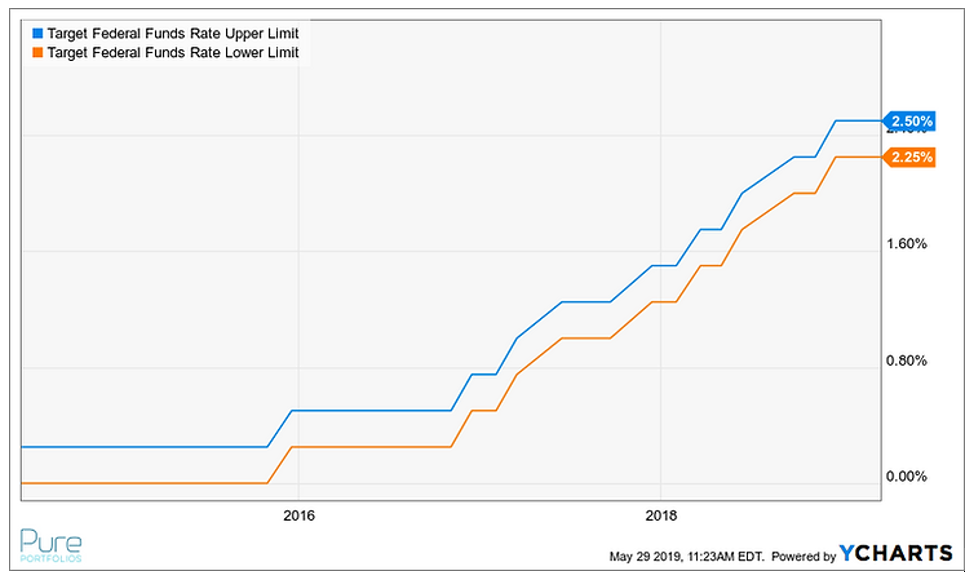
The above graph shows the initial interest rate hike in December 2015. The last increase of the cycle looks to be December 2018. The target Fed Funds rate currently sits at 2.25%-2.50%.
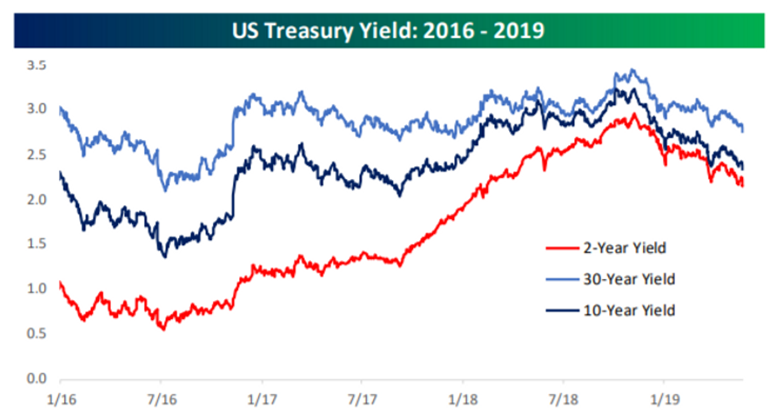
Looking back at U.S. Treasury yields, not much happened, especially with longer maturity bonds:

Source: Bespoke Investment Group
The above graphic shows various maturities of U.S. Treasuries. Although, 2-year yields moved higher (red), longer dated 10-year (dark blue) and 30-year (light blue) barely budged. This makes sense as the Fed has heavy influence over shorter-term yields, while the market sets longer term yields (growth & inflation).
What about the herd perception that bonds would be crushed due to the rising rate environment?
Again, that was more noise than substance:

Source: Portfolio Visualizer
The above table shows calendar year returns for the total U.S. Bond Market, U.S. Corporate Bonds, and Intermediate U.S Treasuries. Other than a rough stretch in 2018, there’s nothing out of the ordinary. Note: 2015 return figures only include December (that’s when the Fed started to increase rates). 2019 return figures are through April.
What does this mean for Fed monetary policy going forward? Believe it or not, the market is aggressively pricing in interest rate cuts. Either market expectations are wildly wrong or we are going to get some sort of economic event in the next six to twelve months. Mr. Bond and Mr. Market are telling two different stories.

Source: Bespoke Investment Group
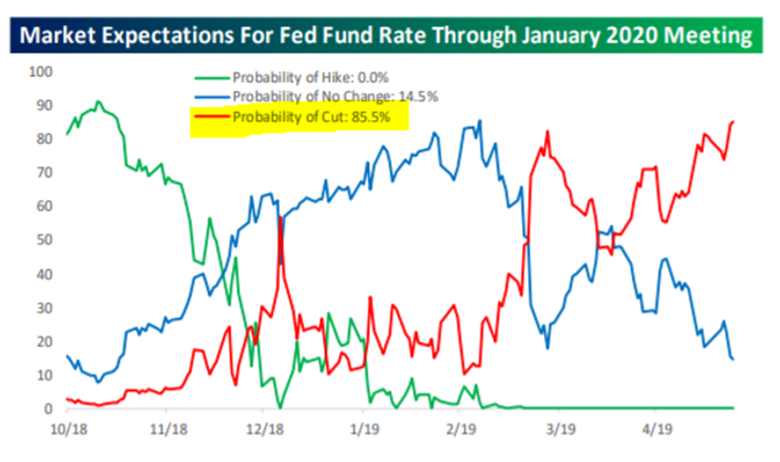
The above graph shows the probability of a rate cut at 85.5% (red) between now and the January 2020 Fed meeting. The next most likely outcome is a “no change” (blue). You can see the probability of a interest rate hike is 0% (green). How quickly expectations can change!
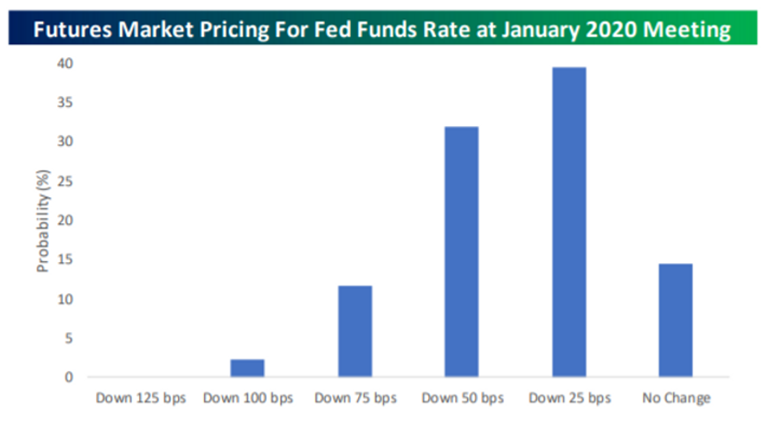
The market is not only pricing in one rate cut, but multiple:

Source: Bespoke Investment Group
The above graphic shows almost a 50% probability that the Fed decreases interest rates more than once in 2019.
Why such a dramatic shift in Fed policy?
The short answer is global growth and inflation keep getting revised down, down, down. Throw in some random disruptive trade threats from the world’s largest economies (U.S. & China) and you get capital fleeing to safe haven assets. Furthermore, several developed countries have zero or negative yielding debt making U.S. bonds relatively attractive.
Interest rate cuts are not normal at this point in the cycle. Either the market needs to reprice the odds of a rate cut or a recession could be around the corner.
Feel free to reach out to learn more about how we’re positioning fixed income portfolios or read on for further Pure commentary:
Let’s Talk Yield Curve Inversion
Back to Back Negative Return Years for Bonds
Share your questions and feedback on Twitter @pureportfolios or insight@pureportfolios.com
